Web-based Visualization of the 3D City Models
Part 1: Cesium Digital Globe and 3D Tiles
This article is intended to give a brief introduction to the web-based 3D visualization of 3D city models. For this purpose, the creation of a 3D visualization of Wermelskirchen with the digital globe Cesium is created using an example. Why Wermelskirchen and not New York? The 3D building model of Wermelskirchen is also freely available, and it is somewhat more manageable than New York. According to the motto “Think big, start small”, a workflow is presented step by step that shows how to create a visualization in Cesium based on a 3D building model in CityGML. For this purpose, the CityGML database is converted into the 3D Tiles data format, which has been optimized for web-based 3D visualization and displayed in Cesium. The first step is to show how the visualization is done in Cesium. It is assumed that the Wermelskirchen 3D building model is already available as 3D tiles. Then you can see something. In the second step, the conversion from CityGML to 3D Tiles is explained.
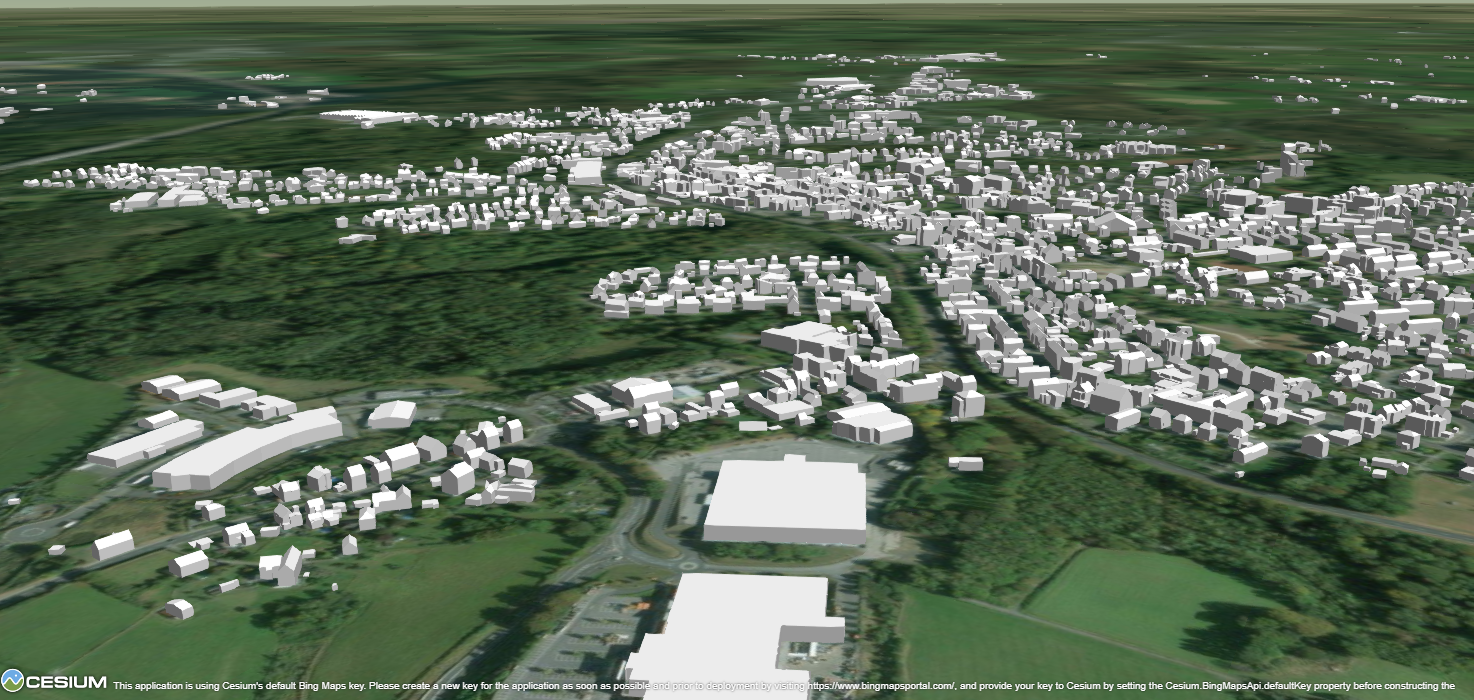
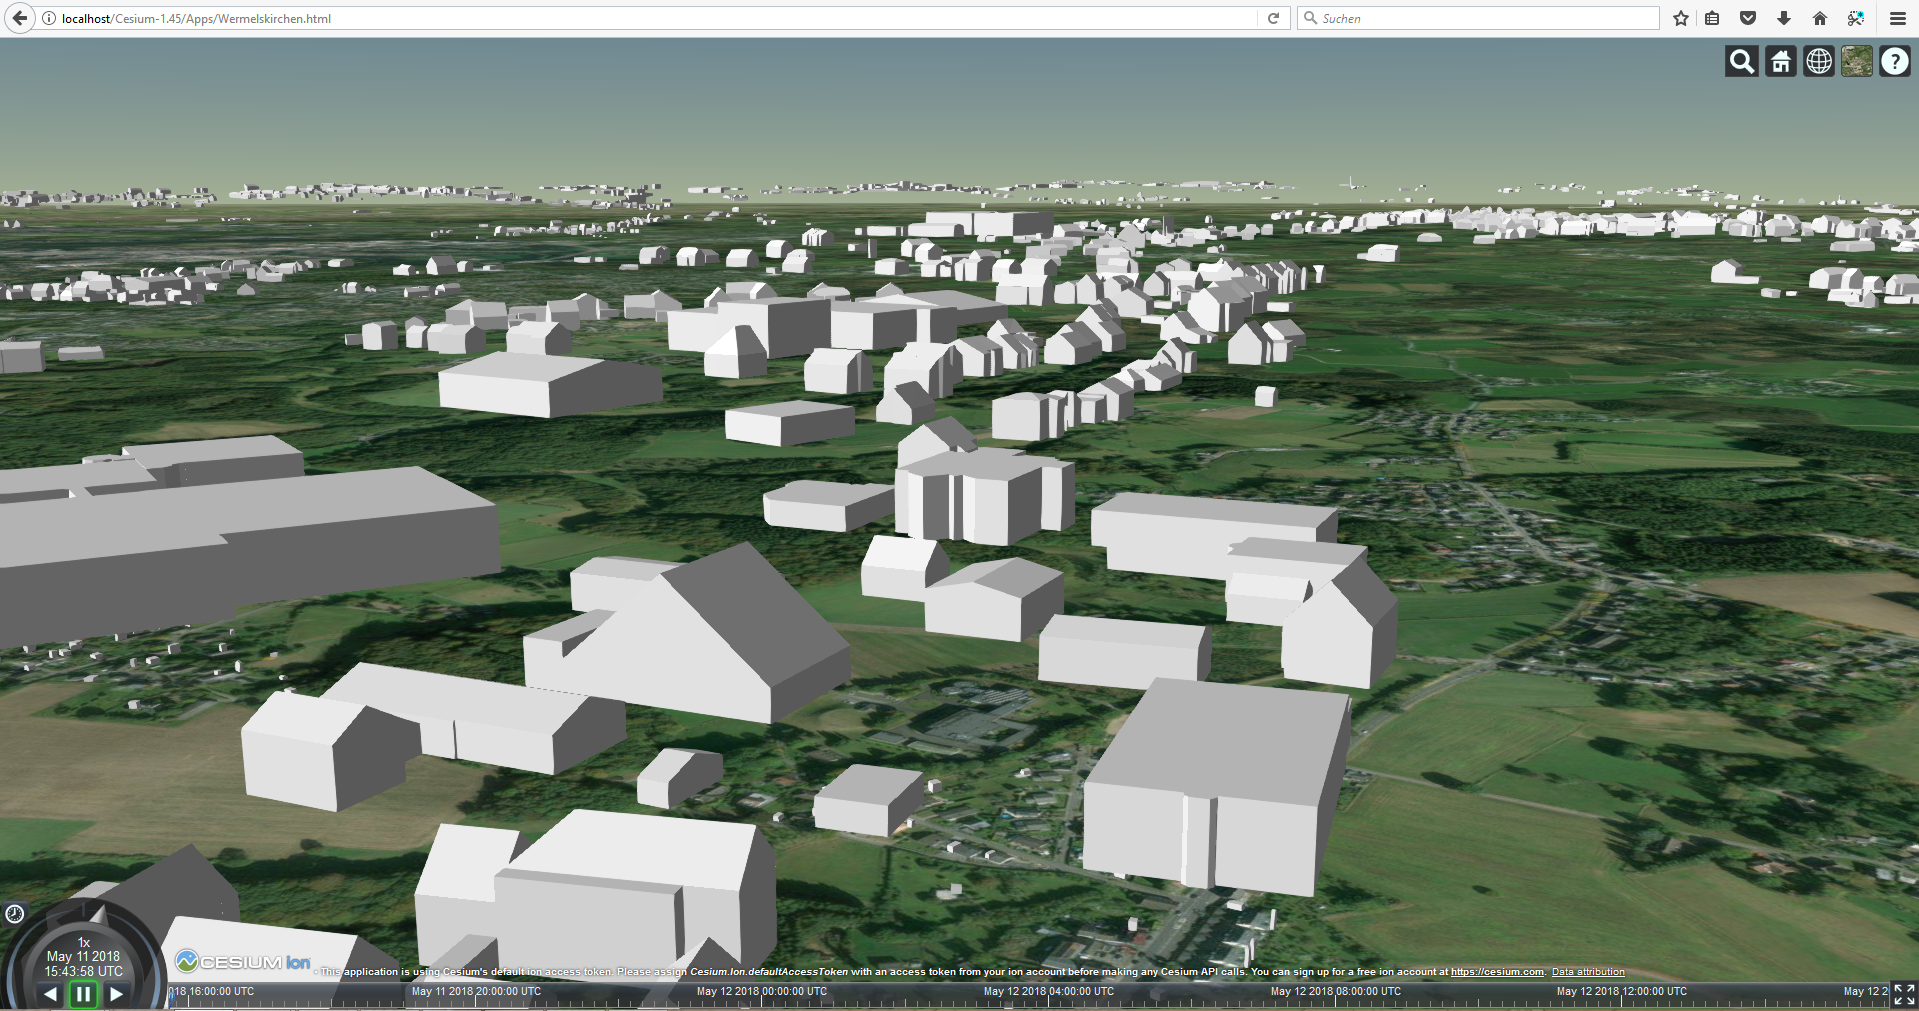
Visualization of the 3D building model in Wermelskirchen. Data source: GeoBasis NRW, 3D building model LoD2, CC BY 3.0 DE
The Digital Globe Cesium
The Cesium digital globe can be downloaded from https://cesiumjs.org/downloads/. It should be run on its own web server. Basically, there are no restrictions as to which web server is used. In the Cesium installation guide (https://cesiumjs.org/tutorials/cesium-up-and-running/) Node.js is used. In the example shown here, Apache HTTP Server is used as the webserver. No matter which web server is used, after successful installation the digital globe with the usual "Hello World" should be visible.
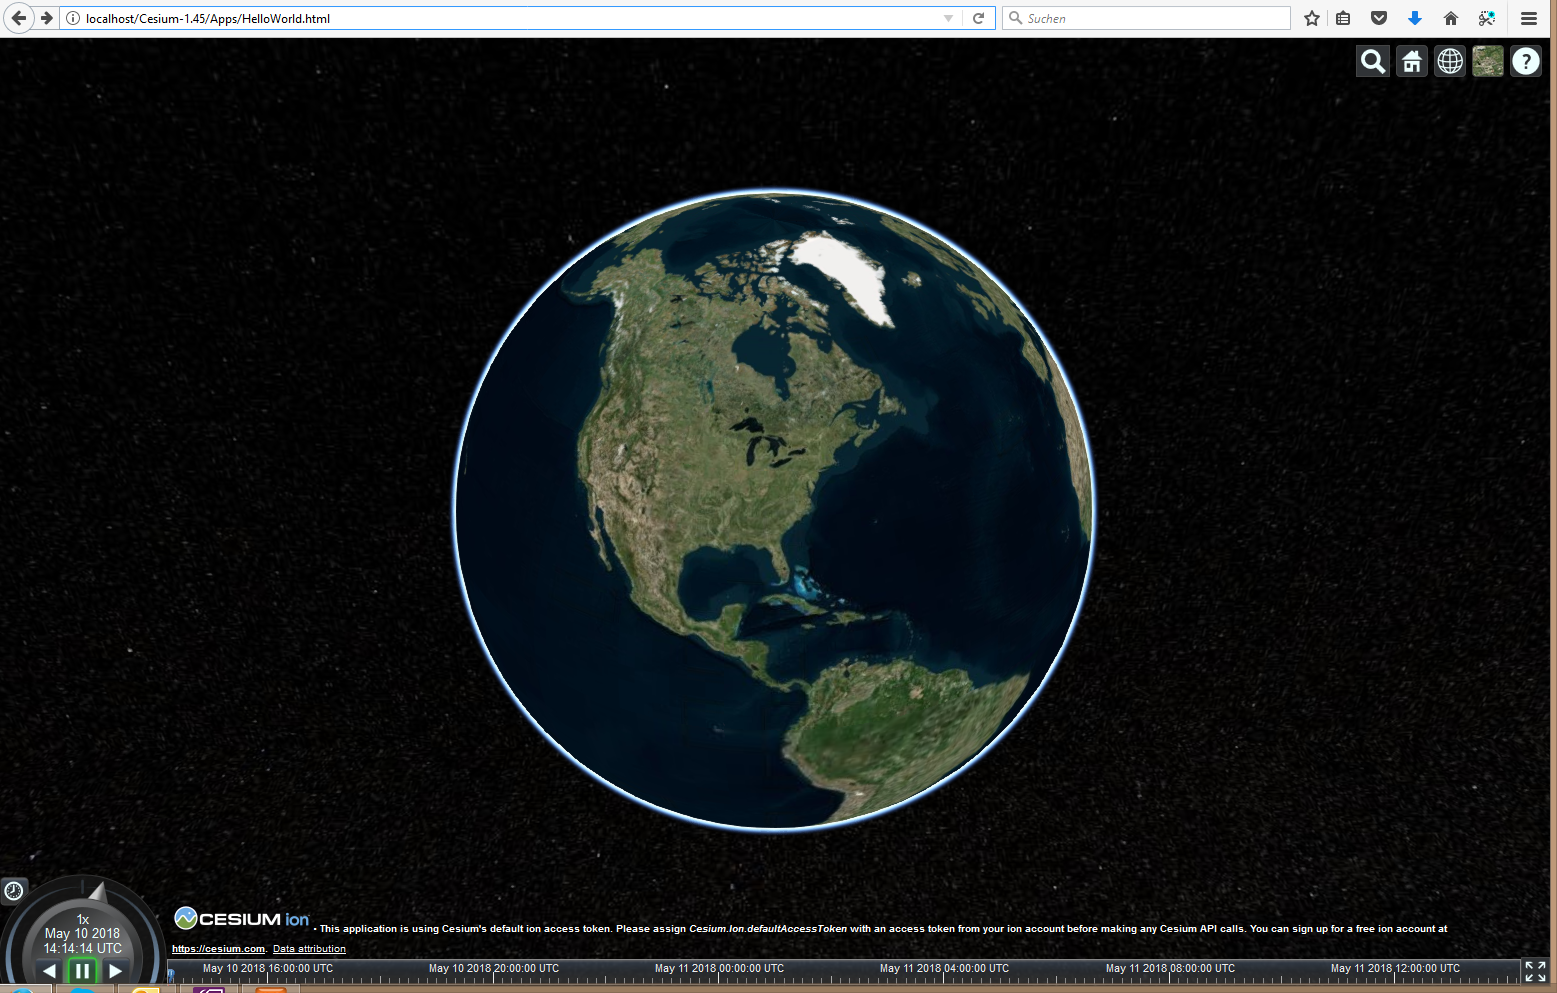
Cesium Hello World, (CC BY 3.0 DE)
3D Tiles
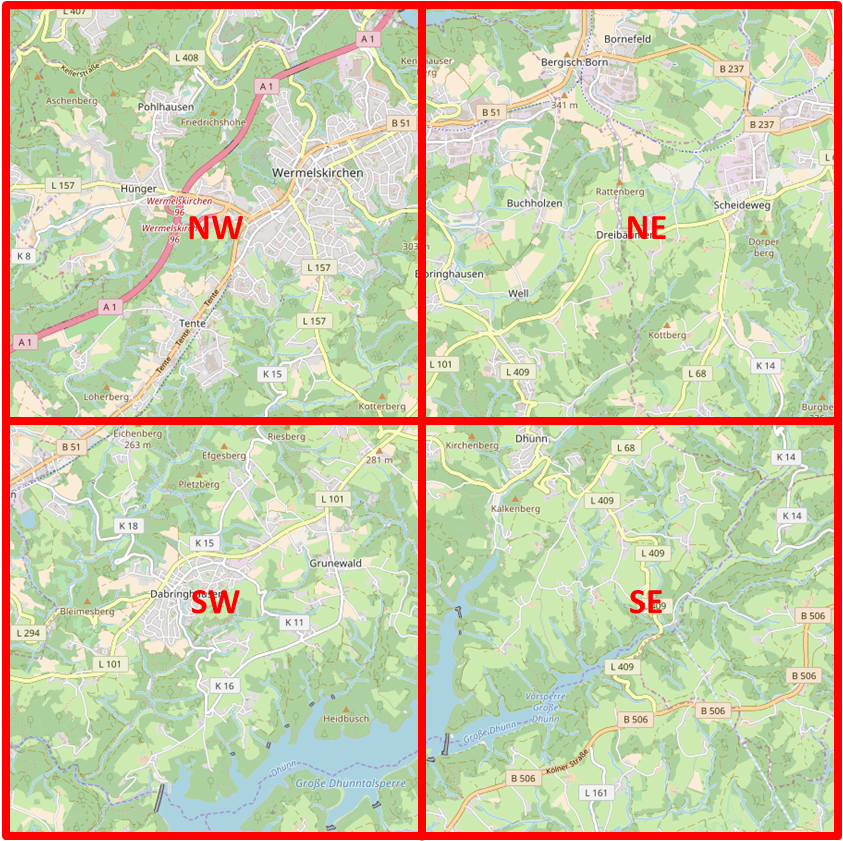
3D Tiles is a hierarchically structured scene graph in which a large 3D model is divided into tiles in order to realize a quick display in the web browser. The aim is to transfer a first simplified model to the web browser and display it as quickly as possible. The scene is shown in more detail with user interactions such as zooming in by reloading further tiles. A quadtree data structure is ideal for creating the tiles in 3D building models. An area is regularly divided into 4 quadrants, which are named according to the cardinal directions NE, SE, SW, and NW.
Each square is further subdivided according to the same pattern. This creates a hierarchical tile structure that can also be found in the files of the 3D scene.
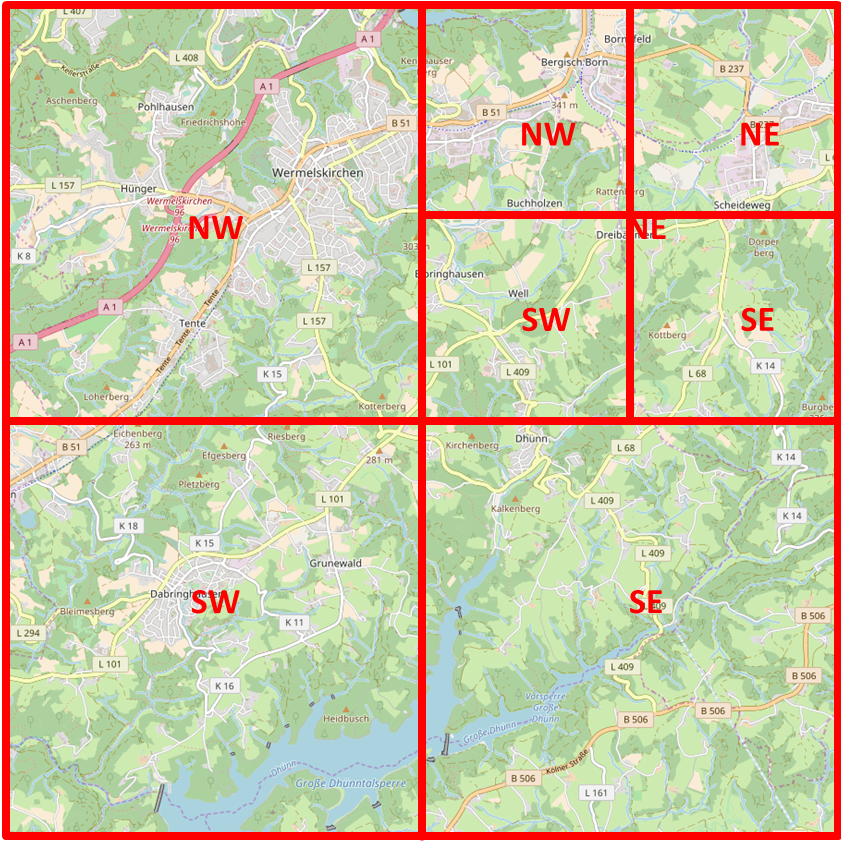
Recursive subdivision of the NE tile. (CC BY 3.0 DE)
A correspondingly generated data set from Wermelskirchen is made available in the Wermelskirchen3DTiles archive. How this data set was created from the CityGML model is explained in the second part of this example. First of all, it is a matter of understanding the structure and visualizing it in the Cesium viewer.
After downloading and unpacking the archive, the following file structure was created:
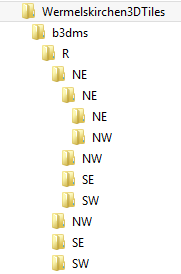
The folder structure corresponds to the quadtree structure (CC BY 3.0 DE)
There Wermelskirchen3DTilesis a file in the folder tileset.json. The entire scene graph is included here, on the basis of which the Cesium Viewer decides which data is to be transmitted and when to be displayed on the screen. The file can be viewed in a normal editor such as Notepad ++. Since it is a JSON file, the use of a JSON plug-in for Notepad ++ such as JSToolNpp, or the VS Code are recommended.
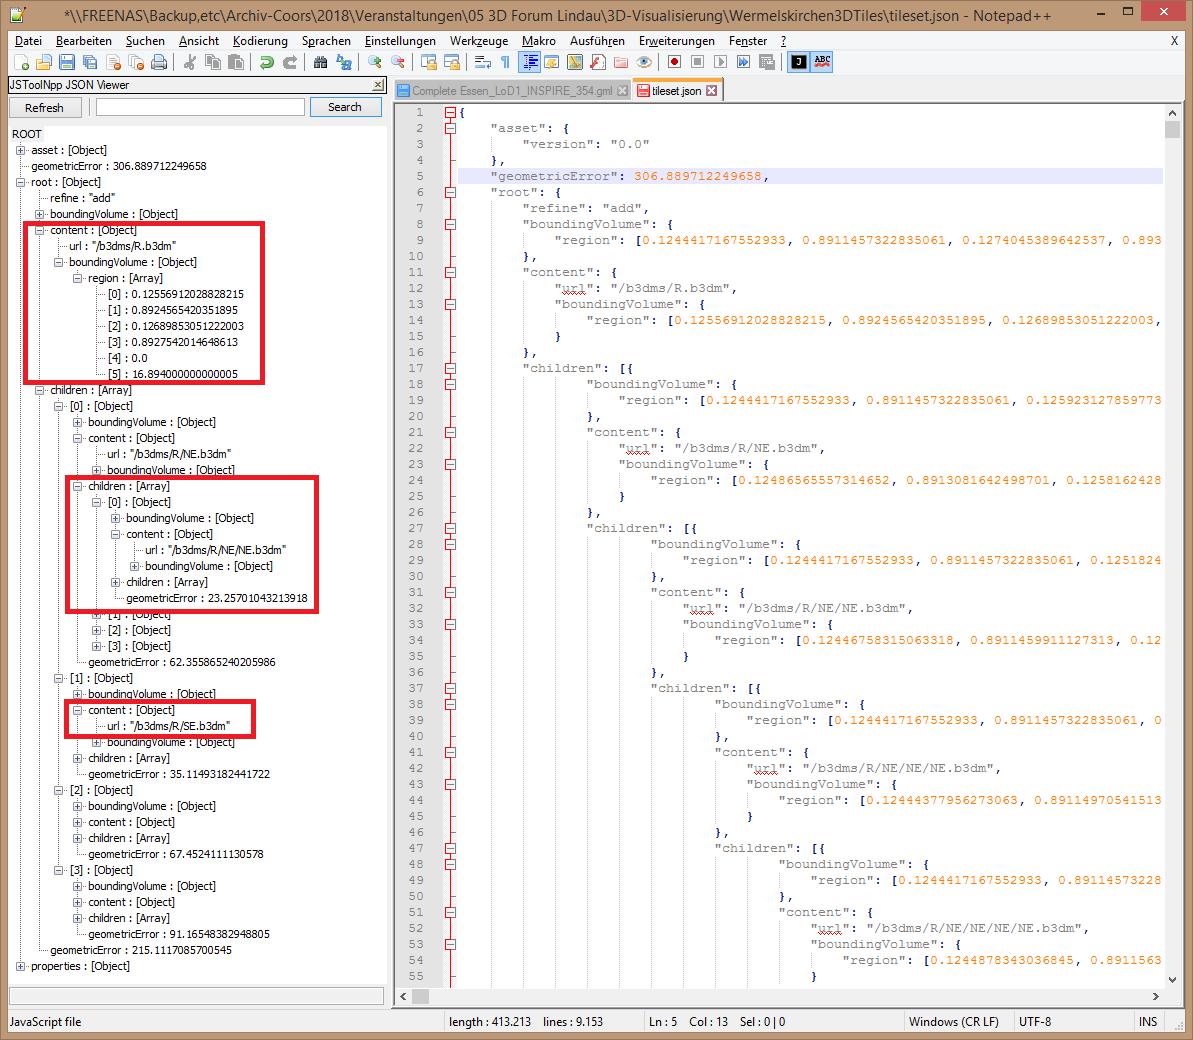
The tileset.json file contains the scene graph used by the Cesium Viewer. (CC BY 3.0 DE)
The structure of the JSON file corresponds to the quadtree structure. For each quadrant, the coordinates of the envelope volume (boundingVolume), the display geometry of the tile ( content), and the max. Defects errors compared to the original building geometry (geometry error). The actual display geometry is b3dmsaved in an external file in the binary format. The geometry is always saved as a triangular mesh. Textures and attribute data can also be stored. These files can be found in the folder structure according to the quadtree structure, e.g. under ./b3dms/R/NE.b3dmand ./b3dms/R/NE/NE.b3dm. A simplified 3D model is saved for each tile. The original building geometry can be found in the leaves of the scene graph, i.e. with tiles that are not further subdivided. Based on the geometry error in the tile (geometry error) and the point of view (camera) from which the scene is viewed, the Cesium Viewer decides which tiles are to be loaded and displayed.
More details about 3D tiles can be found in Patrick Cozzi's blog.
In order to display the 3D tiles in Cesium, the files must be copied to the web server, e.g. in Apache in the directory htdocs. In addition, an HTML file must be created in which the model is linked to the Cesium viewer. The easiest way to do this is to copy the above-mentioned file HelloWorld.html from Cesium and add the following JavaScript.
The Cesium Viewer is instantiated in the first line. The instruction viewer.scene.primitives.add adds the tileset to the globe. This file contains all the information necessary to decide, depending on the camera position, which tile must be loaded and displayed in the globe. The following instructions define the initial position and orientation of the camera so that 3D building models can be seen when the website is loaded.
The result is Wermelskirchen.html saved in the file. The first view of Wermelskirchen is shown in the following figure.
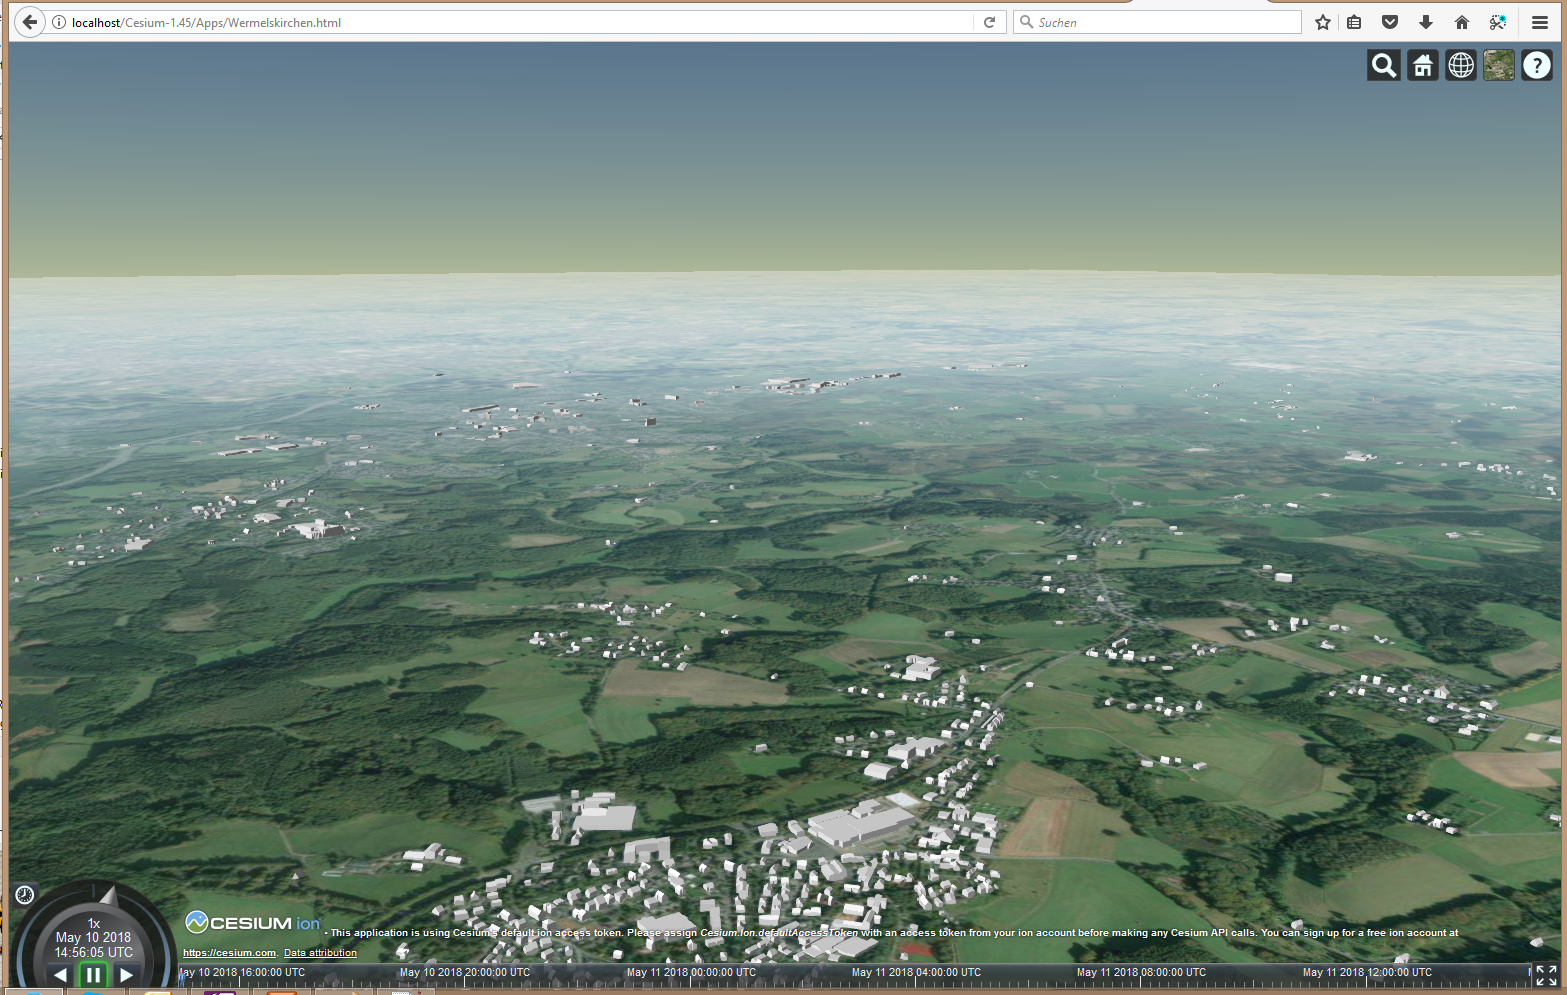
Wermelskirchen Data source: GeoBasis NRW, 3D building model LoD2, CC BY 3.0 DE
Part 2: Converting CityGML to 3D Tiles
The first part of the blog showed how a 3D city model can be visualized in the digital globe Cesium. But where does the required 3D tiles scene graph come from?
Visualization of the 3D building model in Wermelskirchen. Data source: GeoBasis NRW, 3D building model LoD2, CC BY 3.0 DE
A 3D building model LoD 2 is available as a CityGML data set from Wermelskirchen via the Open Data Portal NRW and can be downloaded here. To create a 3D tile scene graph, you have to convert the CityGML dataset. To do this, you need software that can do that. There are enough options here:
- FME supports 3D tiles since version FME 2017.
- Companies such as virtualcitySYSTEMS and Cesium offer the conversion of CityGML to 3D Tiles as a service or such a converter is part of the product range
- The GeoRocketgeodatabase with the additional GeoToolbox from Fraunhofer IGD includes a CityGML to 3D tiles converter
Unfortunately, there is currently no free software for download that CityGML can use to convert to 3D tiles. In this example the GeoToolbox from Fraunhofer IGD is used.
The CityGML model Wermelskirchen consists of numerous individual files. These files are first combined into one large file wermelskirchen.gml. This can be done, for example, by importing the individual files into the 3D CityDB or GeoRocket database and then exporting the entire area into a CityGML file.
With the instruction
geo-toolbox-3dtiles --in ".\in\wermelskirchen.gml" --out .\out\ --srsInCode 25832 --strategy quadTree
                --doubleSided true
Then, the CityGML model is converted to 3D tiles. A quadtree structure is used as the strategy for tiling. The EPSG code of the input data set is srsInCode specified with the parameter . The parameter double-sided defines whether a polygon is visible from both sides (true) or only from the direction opposite to the surface normal (false), i.e. from the outside. With this definition, double sided true, incorrectly oriented areas are no longer visible. Possible errors in the geometry remain, but you just don't see them anymore.
The result is the file structure of 3D Tiles described in the first part of the blog. This still has to be made available on a web server, and the 3D model is ready in the web browser. If you look closely, there is unfortunately still something to be done. Wermelskirchen has lifted off and hovered over the globe. This is because the globe does not use a terrain model, the ground level is always zero. The building geometry uses the height above sea level. Therefore the buildings are in the air.
Wermelskirchen hovers over the globe. Datenquelle: GeoBasis NRW, 3D-Gebäudemodell LoD2, CC BY 3.0 DE
What can you do to avoid the floating buildings? Either the building floor plans are shifted to the height z = 0 or a terrain model is used.
In order to bring the buildings onto the globe, the height of the floor plan polygon of a building is subtracted from all coordinates of the respective building geometry. The floor plan is then at z = 0, otherwise, the building geometry remains the same. The software solution clamp2groundfrom Athanasios Koukofikis, HFT Stuttgart, can be used for this. To do this, the clamp2ground archive must be unpacked. The CityGML file is clamp2ground\in\copied into the folder. Then the clamp2groundsoftware is started with the .bat or .sh file of the same name. As a result, the transformed CityGML file is then in the folder clamp2ground\out\. If the result file is converted to 3D tiles as described above, the buildings are on the globe.

Wermelskirchen projected onto the Cesium globe. Datenquelle: GeoBasis NRW, 3D-Gebäudemodell LoD2, CC BY 3.0 DE
Alternatively, a terrain model can also be integrated into the Cesium Globus. To do this, the JavaScript in the file Wermelskirchen.html must be expanded. The following instruction tells Cesium that a 3D terrain model should be used for the display. The terrain model is provided by the Cesium World Terrain Server by default.
Unfortunately, the building and the terrain do not fit together perfectly, which is probably due to the resolution of the terrain model. Other terrain models can also be integrated, as described in the Cesium tutorial . The use of the terrain model, which is provided by GeoBasis NRW as Open Data, is a nice exercise. Good luck with that.
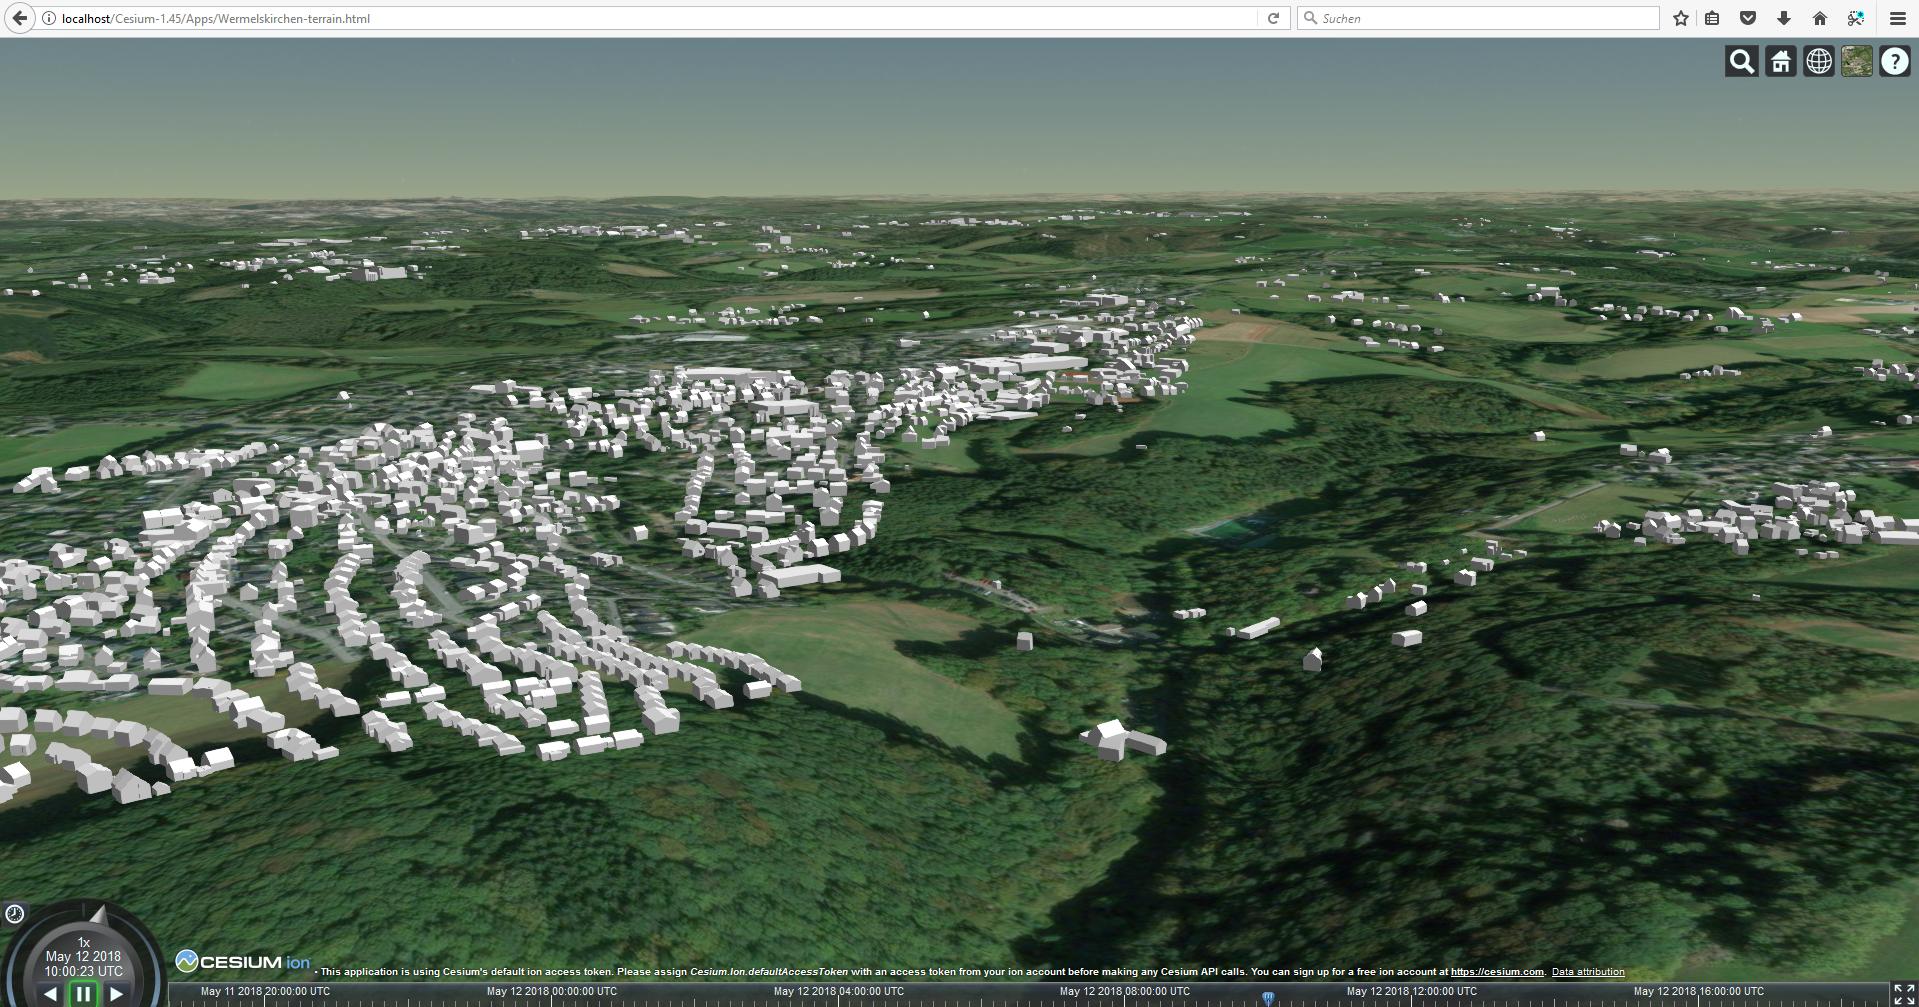
Wermelskirchen building model with terrain model, data source: terrain model: Cesium World Terrain, building model GeoBasis NRW, 3D building model LoD2, CC BY 3.0 DE
Overview of the software used
- CesiumJS
- Web Server: Apache HTTP Server , is also in XAMPP included
- Editor: Notepad ++ with JSON plugin JSToolNpp
- Web browser: Firefox v56.0
- clamp2ground , Athanasios Koukofikis, HFT Stuttgart
- geotoolbox CityGML to 3D Tiles converter: unfortunately not available for download, please contact Ralf Gutbell, Fraunhofer IGD.
Credentials
- Blog dragons8mycat: "Creating a Cesium virtual globe with v1.36" from 5.9.2017
- Tim Rivenbark, 3D building model New York in Cesium, 5.5.2017
Further work
- Coors, V. (Ed.): OGC Testbed 13 - 3D Tiles and I3S Interoperability and Performance Engineering Report, 5.3.2018, http://docs.opengeospatial.org/per/17-046.html, PDF
- Hagedorn, B., Thum, S. Reitz, T., Coors, V., and Gutbell, P. (Eds.): OGC 3D Portrayal Service 1.0, 13.9.2017, http://docs.opengeospatial.org/is /15-001r4/15-001r4.html
Copyright
The texts and images provided in the blog are under the CC BY 3.0 DE license.