Cached queries guidelines
Rails provides an SQL query cache which is used to cache the results of database queries for the duration of a request. When Rails encounters the same query again within the same request, it uses the cached result set instead of running the query against the database again.
The query results are only cached for the duration of that single request, and don't persist across multiple requests.
Why cached queries are considered bad
Cached queries help by reducing the load on the database, but they still:
- Consume memory.
- Require Rails to re-instantiate each
ActiveRecordobject. - Require Rails to re-instantiate each relation of the object.
- Make us spend additional CPU cycles to look into a list of cached queries.
Although cached queries are cheaper from a database perspective, they are potentially more expensive from a memory perspective. They could mask N+1 query problems, so you should treat them the same way you treat regular N+1 queries.
In cases of N+1 queries masked by cached queries, the same query is executed N times. It doesn't hit the database N times but instead returns the cached results N times. This is still expensive because you need to re-initialize objects each time at a greater expense to the CPU and memory resources. Instead, you should use the same in-memory objects whenever possible.
When you introduce a new feature, you should:
- Avoid N+1 queries.
- Minimize the query count.
- Pay special attention to ensure cached queries are not masking N+1 problems.
How to detect cached queries
Detect potential offenders by using Kibana
GitLab.com, logs entries with the number of executed cached queries in the
pubsub-redis-inf-gprd* index as
db_cached_count.
You can filter by endpoints that have a large number of executed cached queries. For
example, an endpoint with a db_cached_count greater than 100 can indicate an N+1 problem which
is masked by cached queries. You should investigate this endpoint further to determine
if it is indeed executing duplicated cached queries.
For more Kibana visualizations related to cached queries, read issue #259007, 'Provide metrics that would help us to detect the potential N+1 CACHED SQL calls'.
Inspect suspicious endpoints using the Performance Bar
When building features, use the performance bar to view the list of database queries, including cached queries. The performance bar shows a warning when the number of total executed and cached queries is greater than 100.
To learn more about the statistics available to you, read the Performance Bar documentation.
What to look for
Using Kibana, you can look for a large number
of executed cached queries. Endpoints with a large db_cached_count could suggest a large number
of duplicated cached queries, which often indicates a masked N+1 problem.
When you investigate a specific endpoint, use the performance bar to identify similar and cached queries, which may also indicate an N+1 query issue (or a similar kind of query batching problem).
An example
For example, let's debug the "Group Members" page. In the left corner of the performance bar, Database queries shows the total number of database queries and the number of executed cached queries:

The page included 55 cached queries. Clicking the number displays a modal window
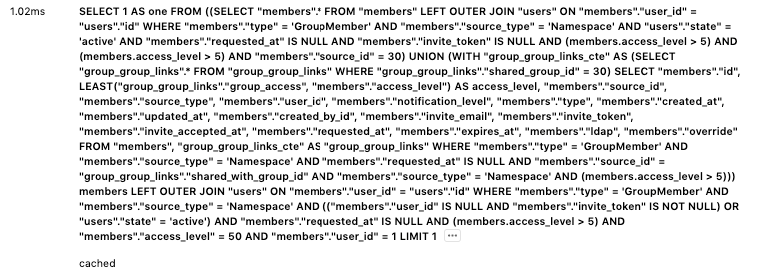
with more details about queries. Cached queries are marked with the cached label
below the query. You can see multiple duplicate cached queries in this modal window:
Click ... to expand the actual stack trace:
[
  "app/models/group.rb:305:in `has_owner?'",
  "ee/app/views/shared/members/ee/_license_badge.html.haml:1",
  "app/helpers/application_helper.rb:19:in `render_if_exists'",
  "app/views/shared/members/_member.html.haml:31",
  "app/views/groups/group_members/index.html.haml:75",
  "app/controllers/application_controller.rb:134:in `render'",
  "ee/lib/gitlab/ip_address_state.rb:10:in `with'",
  "ee/app/controllers/ee/application_controller.rb:44:in `set_current_ip_address'",
  "app/controllers/application_controller.rb:493:in `set_current_admin'",
  "lib/gitlab/session.rb:11:in `with_session'",
  "app/controllers/application_controller.rb:484:in `set_session_storage'",
  "app/controllers/application_controller.rb:478:in `set_locale'",
  "lib/gitlab/error_tracking.rb:52:in `with_context'",
  "app/controllers/application_controller.rb:543:in `sentry_context'",
  "app/controllers/application_controller.rb:471:in `block in set_current_context'",
  "lib/gitlab/application_context.rb:54:in `block in use'",
  "lib/gitlab/application_context.rb:54:in `use'",
  "lib/gitlab/application_context.rb:21:in `with_context'",
  "app/controllers/application_controller.rb:463:in `set_current_context'",
  "lib/gitlab/jira/middleware.rb:19:in `call'"
]
The stack trace shows an N+1 problem, because the code repeatedly executes
group.has_owner?(current_user) for each group member. To solve this issue,
move the repeated line of code outside of the loop, passing the result to each rendered member instead:
- current_user_is_group_owner = @group && @group.has_owner?(current_user)

= render  partial: 'shared/members/member',
          collection: @members, as: :member,
          locals: { membership_source: @group,
                    group: @group,
                    current_user_is_group_owner: current_user_is_group_owner }
After fixing the cached query, the performance bar now shows only 6 cached queries:

How to measure the impact of the change
Use the memory profiler to profile your code.
For this example, wrap the profiler around the Groups::GroupMembersController#index action. Before the fix, the application had
the following statistics:
- Total allocated: 7133601 bytes (84858 objects)
- Total retained: 757595 bytes (6070 objects)
-
db_count: 144 -
db_cached_count: 55 -
db_duration: 303ms
The fix reduced the allocated memory, and the number of cached queries. These factors help improve the overall execution time:
- Total allocated: 5313899 bytes (65290 objects), 1810KB (25%) less
- Total retained: 685593 bytes (5278 objects), 72KB (9%) less
-
db_count: 95 (34% less) -
db_cached_count: 6 (89% less) -
db_duration: 162ms (87% faster)