Dashboard settings (DEPRECATED) (FREE)
Deprecated in GitLab 14.7.
WARNING: This feature is in its end-of-life process. It is deprecated in GitLab 14.7, and is planned for removal in GitLab 16.0.
You can configure your Monitoring dashboard to display the time zone of your choice, and the links of your choice.
To configure these settings you must have Manage Project Operations permissions.
Change the dashboard time zone
Introduced in GitLab 13.1.
By default, your monitoring dashboard displays dates and times in your local time zone, but you can display dates and times in UTC format. To change the time zone:
-
Sign in as a user with Manage Project Operations permissions.
-
Navigate to Settings > Monitor.
-
Scroll to Metrics Dashboard and click Expand.
-
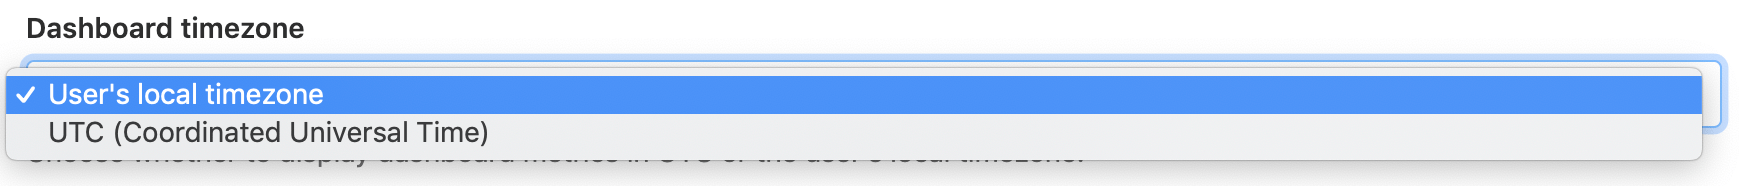
In the Dashboard timezone select box, select User's local timezone or UTC:

-
Click Save changes.
Link to an external dashboard
Introduced in GitLab 12.0.
You can add a button on your monitoring dashboard that links directly to your existing external dashboards:
-
Sign in as a user with Manage Project Operations permissions.
-
Navigate to Settings > Monitor.
-
Scroll to Metrics Dashboard and click Expand.
-
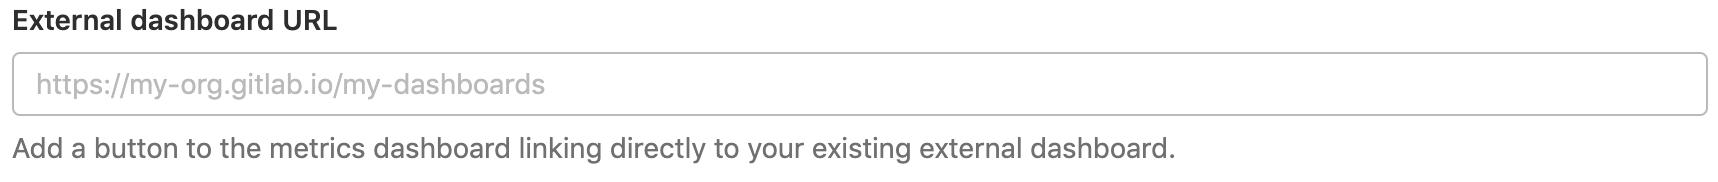
In External dashboard URL, provide the URL to your external dashboard:
-
Click Save changes.
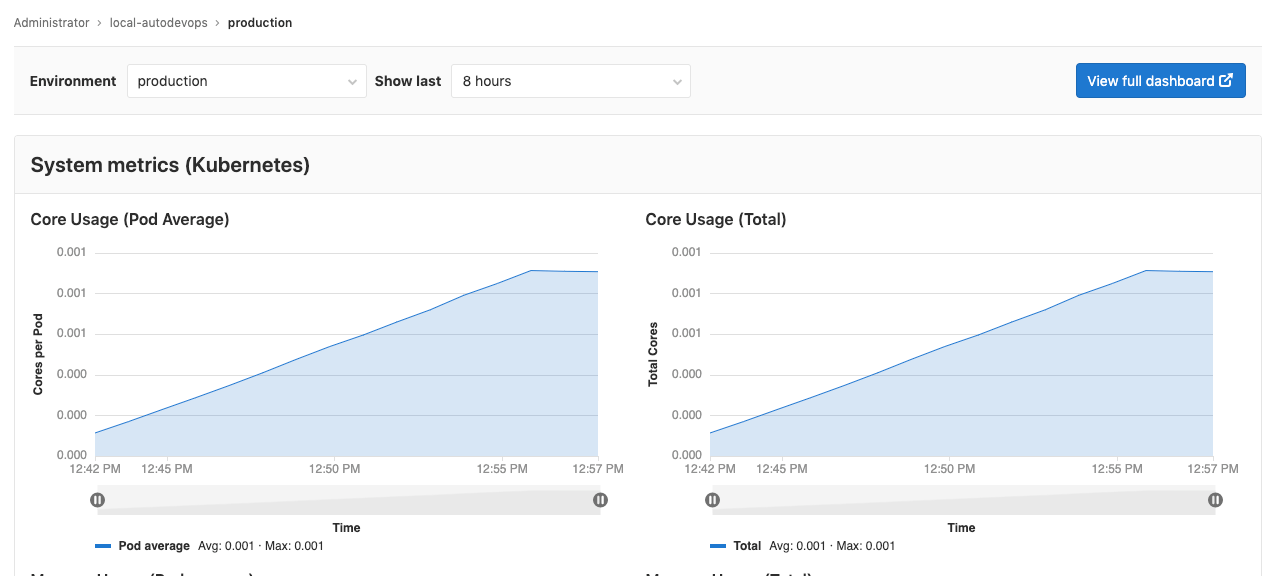
GitLab displays a View full dashboard button in the top right corner of your monitoring dashboard which opens the URL you provided: