Embed Grafana panels in Markdown (FREE)
Grafana panels can be embedded in GitLab Flavored Markdown. You can embed Grafana panels using either:
Use Grafana-rendered images
You can embed live Grafana panels as a direct linked rendered image. Your Grafana instance must:
- Be available to the target user, either as a public dashboard or on the same network.
- Have Grafana Image Renderer installed.
To use Grafana-rendered images:
- Go to the dashboard containing the panel in Grafana.
- From the panel's menu, select Share.
- Select the Direct link rendered image button, which provides the link.
- Copy the link and add an image tag as inline HTML in your
Markdown in the format
<img src="your_link"/>. You can tweak the query parameters to meet your needs, such as removing the&from=and&to=parameters to display a live panel.
Use integration with Grafana API
Introduced in GitLab 12.5.
Each project can support integration with one Grafana instance. This enables you to copy a link to a panel in Grafana, then paste it into a GitLab Markdown field. The panel renders in the GitLab panel format. To embed panels from a Grafana instance, the data source must be:
- A Prometheus instance.
- Proxyable, so the HTTP > Access setting for the Grafana data source should be set to Server (default).
Set up Grafana integration
To set up the Grafana API in Grafana:
- In Grafana, generate an Admin-level API Token.
- In your GitLab project, go to Settings > Monitor and expand the Grafana authentication section.
- To enable the integration, check the Active checkbox.
- For Grafana URL, enter the base URL of the Grafana instance.
- For API Token, enter the Administrator API token you just generated.
- Click Save Changes.
Generate a link to a panel
To generate a link to a panel:
-
In Grafana, go to the dashboard you wish to embed a panel from.
-
In the upper-left corner of the page, select a specific value for each variable required for the queries in the dashboard.
-
In Grafana click on a panel's title, then click Share to open the panel's sharing dialog to the Link tab.
If you click the dashboard's share button instead, GitLab attempts to embed the first supported panel on the dashboard (if available).
-
If your Prometheus queries use Grafana's custom template variables, ensure the Template variables option is set to on. Only the Grafana global template variables
$__interval,$__from, and$__toare supported. -
Set the Current time range option to on, to specify the time range of the panel. Otherwise, the default range is the last 8 hours.
-
Select Copy to copy the URL to the clipboard.
-
In GitLab, paste the URL into a Markdown field and save. The panel takes a few moments to render.
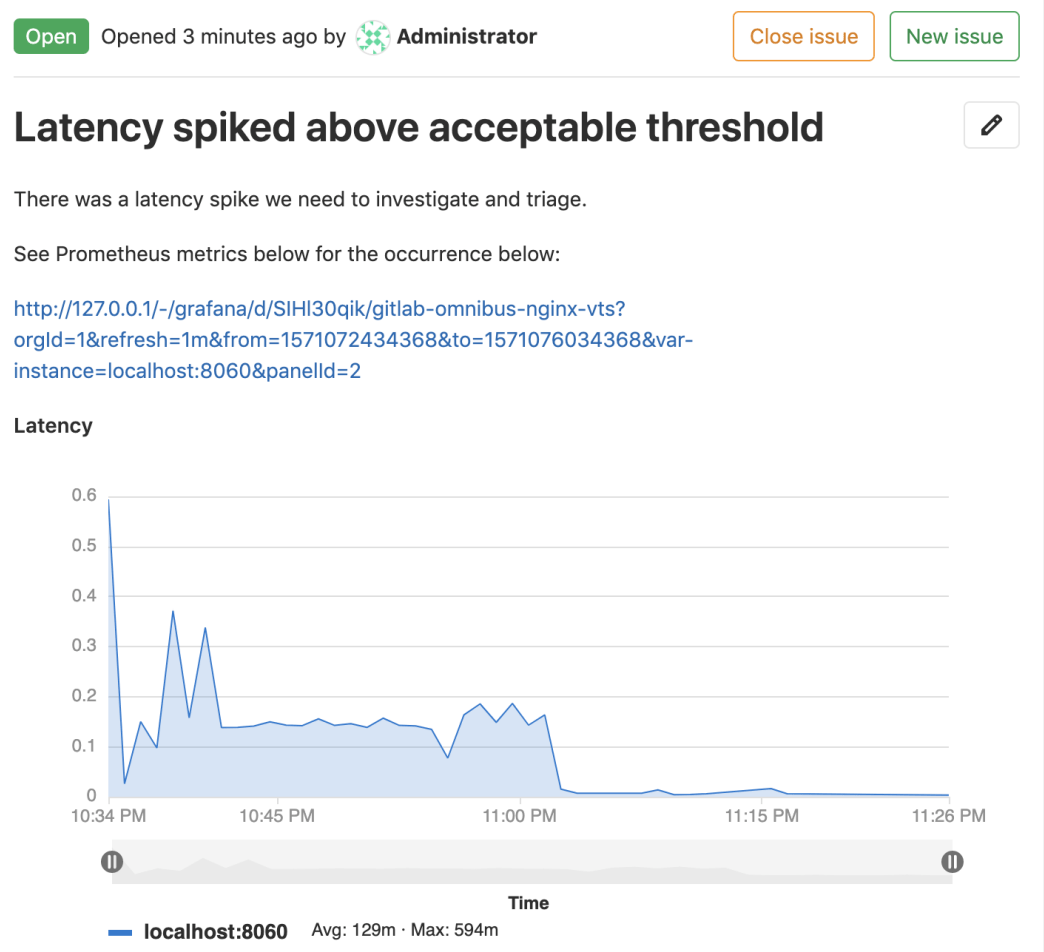
See the following example of a rendered panel.