Cluster cost management (DEPRECATED) (ULTIMATE)
- Introduced in GitLab Ultimate 13.5.
- Deprecated in GitLab 14.5.
WARNING: This feature was deprecated in GitLab 14.5.
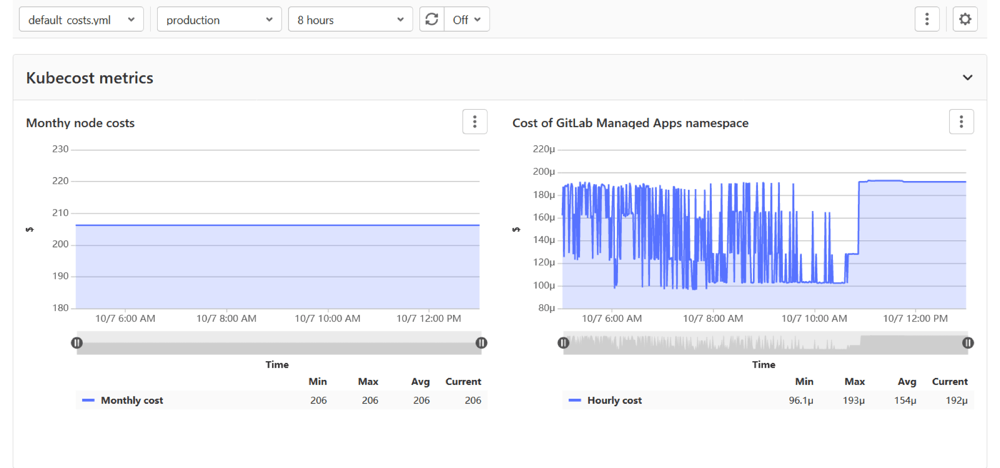
Cluster cost management provides insights into cluster resource usage. GitLab provides an example
kubecost-cost-model
project that uses the GitLab Prometheus integration and
Kubecost's cost-model to provide cluster cost
insights within GitLab:
Configure cluster cost management
To get started with cluster cost management, you need the Maintainer role for a project or group.
- Clone the
kubecost-cost-modelexample repository, which contains minor modifications to the upstream Kubecostcost-modelproject:- Configures your Prometheus endpoint to the GitLab-managed Prometheus. You may need to change this value if you use a non-managed Prometheus.
- Adds the necessary annotations to the deployment manifest to be scraped by GitLab-managed Prometheus.
- Changes the Google Pricing API access key to the GitLab access key.
- Contains definitions for a custom GitLab Metrics dashboard to show the cost insights.
- Connect GitLab with Prometheus, depending on your configuration:
- If Prometheus is already configured, navigate to Settings > Integrations > Prometheus to provide the API endpoint of your Prometheus server.
- To use the Prometheus cluster integration, navigate to your cluster's Details page, select the Integrations tab, and follow the instructions to enable the Prometheus cluster integration.
- Set up the Prometheus integration on the cloned example project.
- Add the Kubecost
cost-modelto your cluster:-
For non-managed clusters, deploy it with GitLab CI/CD.
-
To deploy it manually, use the following commands:
kubectl create namespace cost-model
kubectl apply -f kubernetes/ --namespace cost-model
-
To access the cost insights, navigate to Monitor > Metrics and select
the default_costs.yml dashboard. You can customize
this dashboard.
Customize the cost dashboard
You can customize the cost dashboard by editing the .gitlab/dashboards/default_costs.yml
file or creating similar dashboard configuration files. To learn more, read about
customizing dashboards in our documentation.
Available metrics
Metrics contain both instance and node labels. The instance label is scheduled for deprecation in a future version.
-
node_cpu_hourly_cost- Hourly cost per vCPU on this node. -
node_gpu_hourly_cost- Hourly cost per GPU on this node. -
node_ram_hourly_cost- Hourly cost per gigabyte of memory on this node. -
node_total_hourly_cost- Total node cost per hour. -
container_cpu_allocation- Average number of CPUs requested/used over the previous minute. -
container_gpu_allocation- Average number of GPUs requested over the previous minute. -
container_memory_allocation_bytes- Average bytes of RAM requested/used over the previous minute. -
pod_pvc_allocation- Bytes provisioned for a PVC attached to a pod. -
pv_hourly_cost- Hourly cost per GB on a persistent volume.
Some examples are provided in the
kubecost-cost-model repository.