General Information
This application is based on the virtualcityMAP technology of virtualcitySYSTEMS. It contains, depending on
the configuration, an integrated viewer for oblique images, 2D maps and 3D maps. In case of any questions do
not hesitate to contact your contact person at virtualcitySYSTEMS.
System Requirements
The virtualcityMAP can be used from any computer or workstation with a modern browser which enables the
execution of JavaScript and WebGL. WebGL is an API for rendering 3D computer graphics within a browser without
the use of plug-ins. It is activated in all modern browsers since 2011. Internet Explorer supports WebGL from
version 11. Microsoft Edge supports WebGL from version 0.95.
There is an official website to test if your browser supports WebGL:
http://get.webgl.org.
Wikipedia provides a list of supporting browsers:
https://en.wikipedia.org/wiki/WebGL.
User Interface
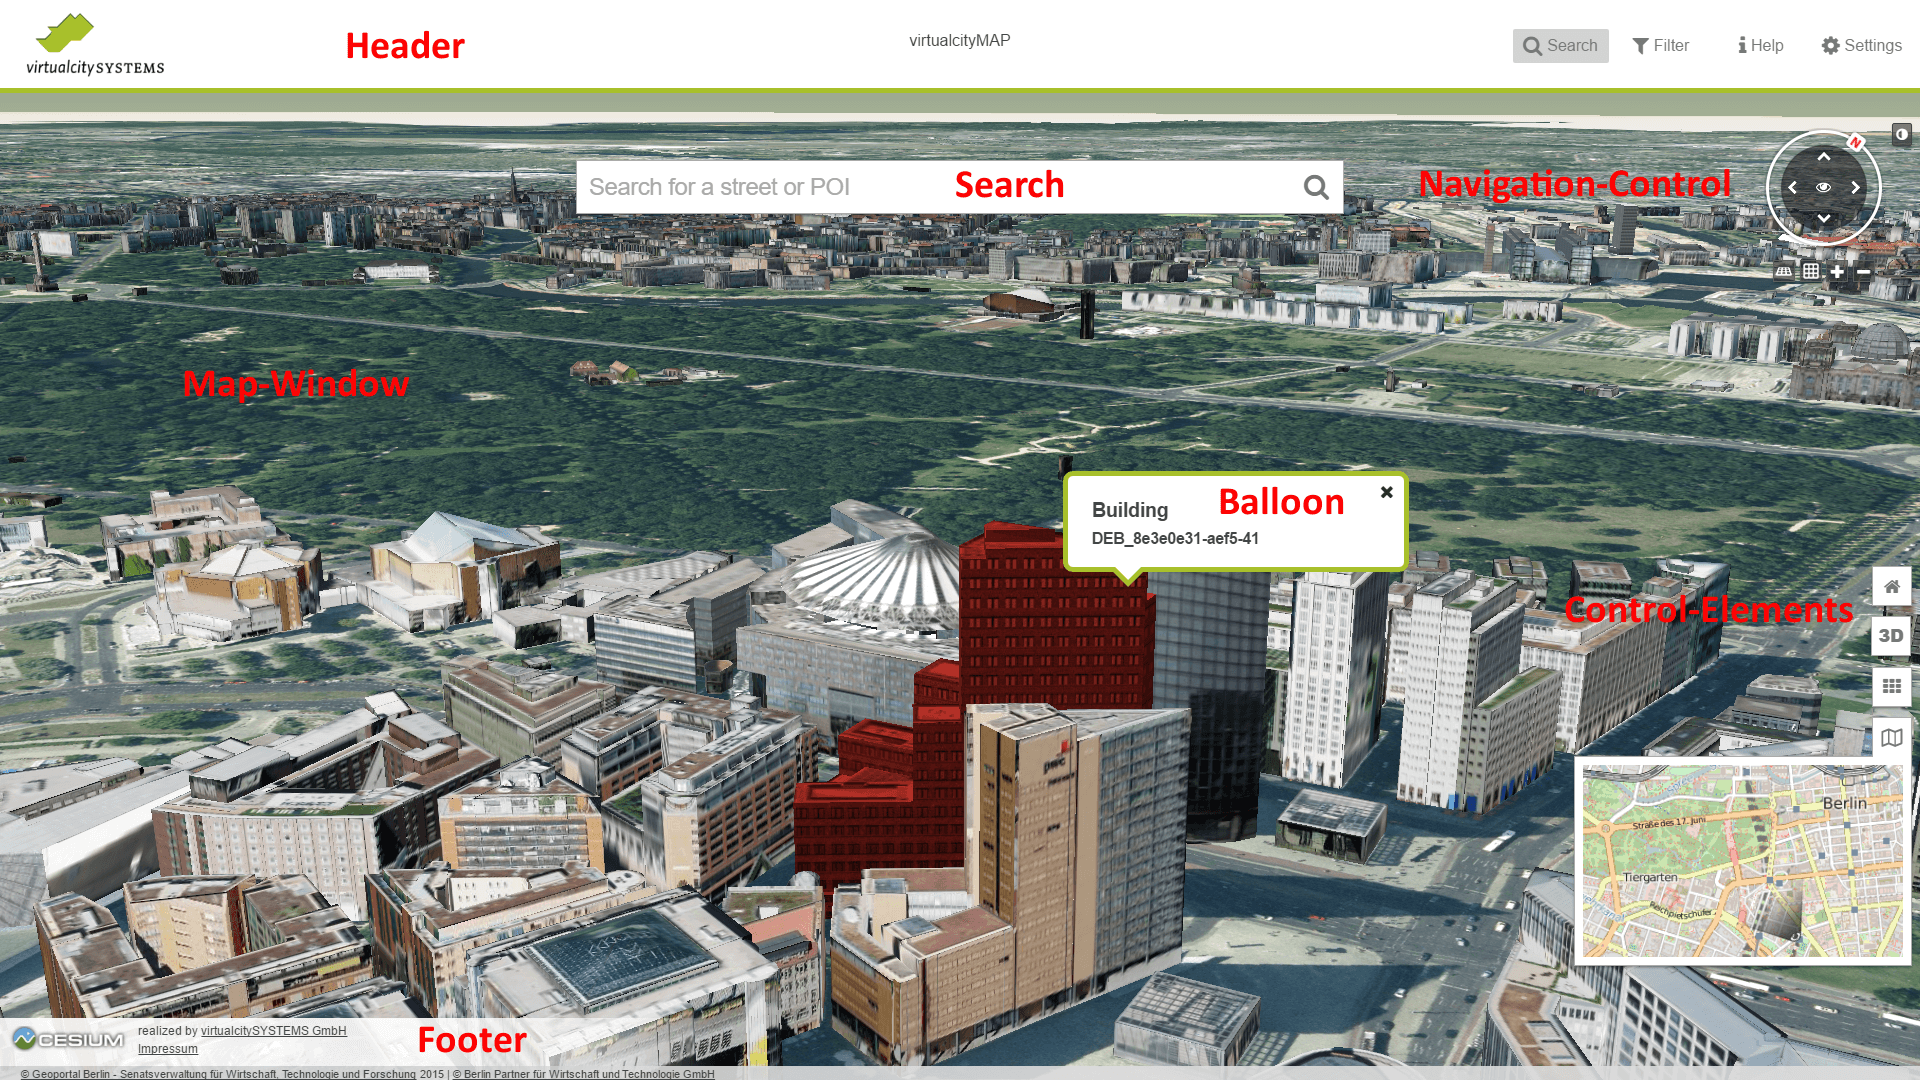
In the map-window of the application next to the search bar there is the navigation-control
as well as the vertical control-elements.
Navigation-Control
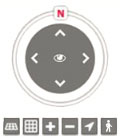 By clicking the arrows in the navigation control it is possible to navigate to the corresponding direction via
mouse click. By clicking the N-symbol the map is oriented towards north. When clicking the eye-symbol the map
starts to rotate around the current view. When clicking the eye-symbol again the rotation will be stopped.
This function is available in the 3D map only.
By clicking the arrows in the navigation control it is possible to navigate to the corresponding direction via
mouse click. By clicking the N-symbol the map is oriented towards north. When clicking the eye-symbol the map
starts to rotate around the current view. When clicking the eye-symbol again the rotation will be stopped.
This function is available in the 3D map only.
The horizontal control elements, located below the
navigation control, allow to tilt the view as well as to zoom in and out.
Pedestrian Mode
Explore the city model in pedestrian mode by first selecting the figure and then placing it in the map.
You can then use the arrow keys on the keyboard to simulate steps forward, back, left and right. By holding
down the right mouse button, you can rotate the figure in the desired direction. Thus, a free movement on the
terrain is obtained.
The control panel in the pedestrian mode also allows you to adjust the viewing angle and
the height of the view over the terrain. To end the pedestrian mode, click on the figure again to deselect it.
Control-Elements
The control elements in the right handed vertical pane provide additional functionality.
By clicking the home-button the application returns to the start view-point.
By clicking one of the OB/2D/3D-buttons the user can switch between the Oblique-, 2D- and 3D-view.
If certain widgets (export, query, etc) are configured for this virtualcityMAP, those can be activated by
clicking the functions-icon with the raster symbol. The available widgets are explained separately.
A click on the map-symbol opens the 2D overview map.
The overview map shows the current view in a larger area. In addition, the position of the camera is
visualized. Thus, this widget facilitates an easier orientation in the map. If the overview-map is activated
in the oblique view, the oblique images' outer rings are visualized in the overview-map additionally.
Selection of Objects
A single building can be selected by a left-click. It will be colored red. If there are additional information
available for this building, those will be provided in an information-balloon. A click on an empty region
(e.g. the terrain) deselects the building.
Multiple buildings can be selected by using the combination
Ctrl+Click. The selected buildings will be colored blue. This function may be used to highlight certain
buildings. It is used by the export widget, too. If multiple buildings are selected, they need to be
deselected individually.
Footer
The footer contains the imprint as well as the data protection notice. Some applications may
provide the coordinates of a clicked positions in the footer. In the oblique view the footer contains the name
of the current oblique images. Additionally, the footer may contain copyright statements for certain layers.
2D-Map View
The 2D-map view provides the following navigation options:
Navigation in the map:
| |
... by mouse |
... by keyboard |
| Map pan |
Left mouse click and pull map |
Press arrow keys to navigate to the corresponding direction |
| Zoom in / Zoom out |
Zoom in or out by spinning the mouse wheel |
Press plus or minus key |
3D-Map View
The 3D-map view visualizes a terrain based on the open-source technology
Cesium. The same terrain texture is used as in the 2D
view. If there are additional layers, these can be activated in the filter menu.
Navigation in the map:
| |
... by mouse |
... by keyboard |
| Map pan |
Left mouse click and pull map |
Press arrow keys to navigate to the corresponding direction |
| Tilt view |
Press mouse wheel and move mouse front or back |
Press 'Page Up' resp. 'Page Down' key |
| Rotate view |
Press mouse wheel and move mouse to the left or right |
Press 'Home' resp. 'End' key |
| Zoom in / Zoom out |
Zoom in or out by spinning the mouse wheel |
Press plus or minus key |
Oblique View
The oblique view shows a single oblique image. The selection of the visualized image is done by its spatial
reference.
Within the oblique view the navigation control can be used to change the viewing direction. If the
overview-map is activated, the oblique images' outer rings are visualized in the overview-map additionally.
A click on the functions-icon (raster symbol) opens a menu providing the measurement widgets (horizontal
and height measurement). A click on the widget's icon activates the widget. The measurement widgets for
oblique image are described separately.
Settings
A click on the 'Settings' icon in the header of the application opens up a settings menu. It allows to change
the settings of the virtualcityMAP.
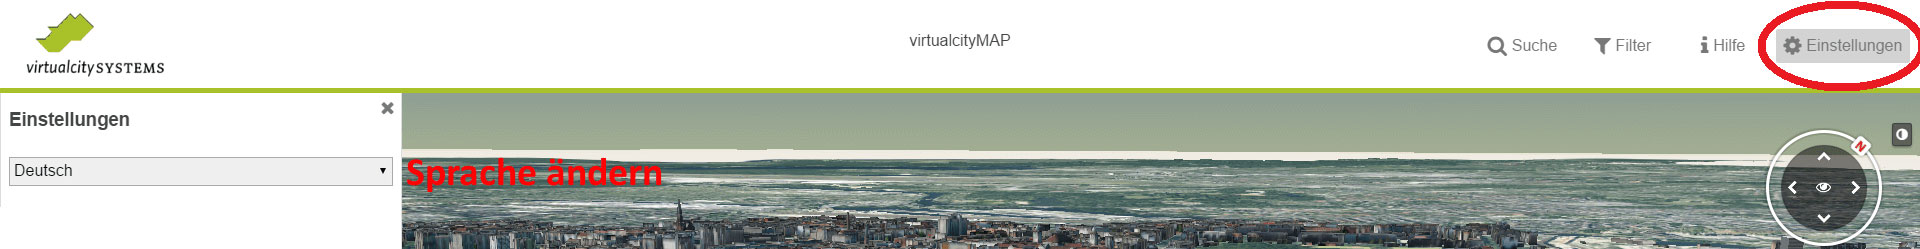
Language Setting
The selection of a language from the drop-down menu changes the application's language.
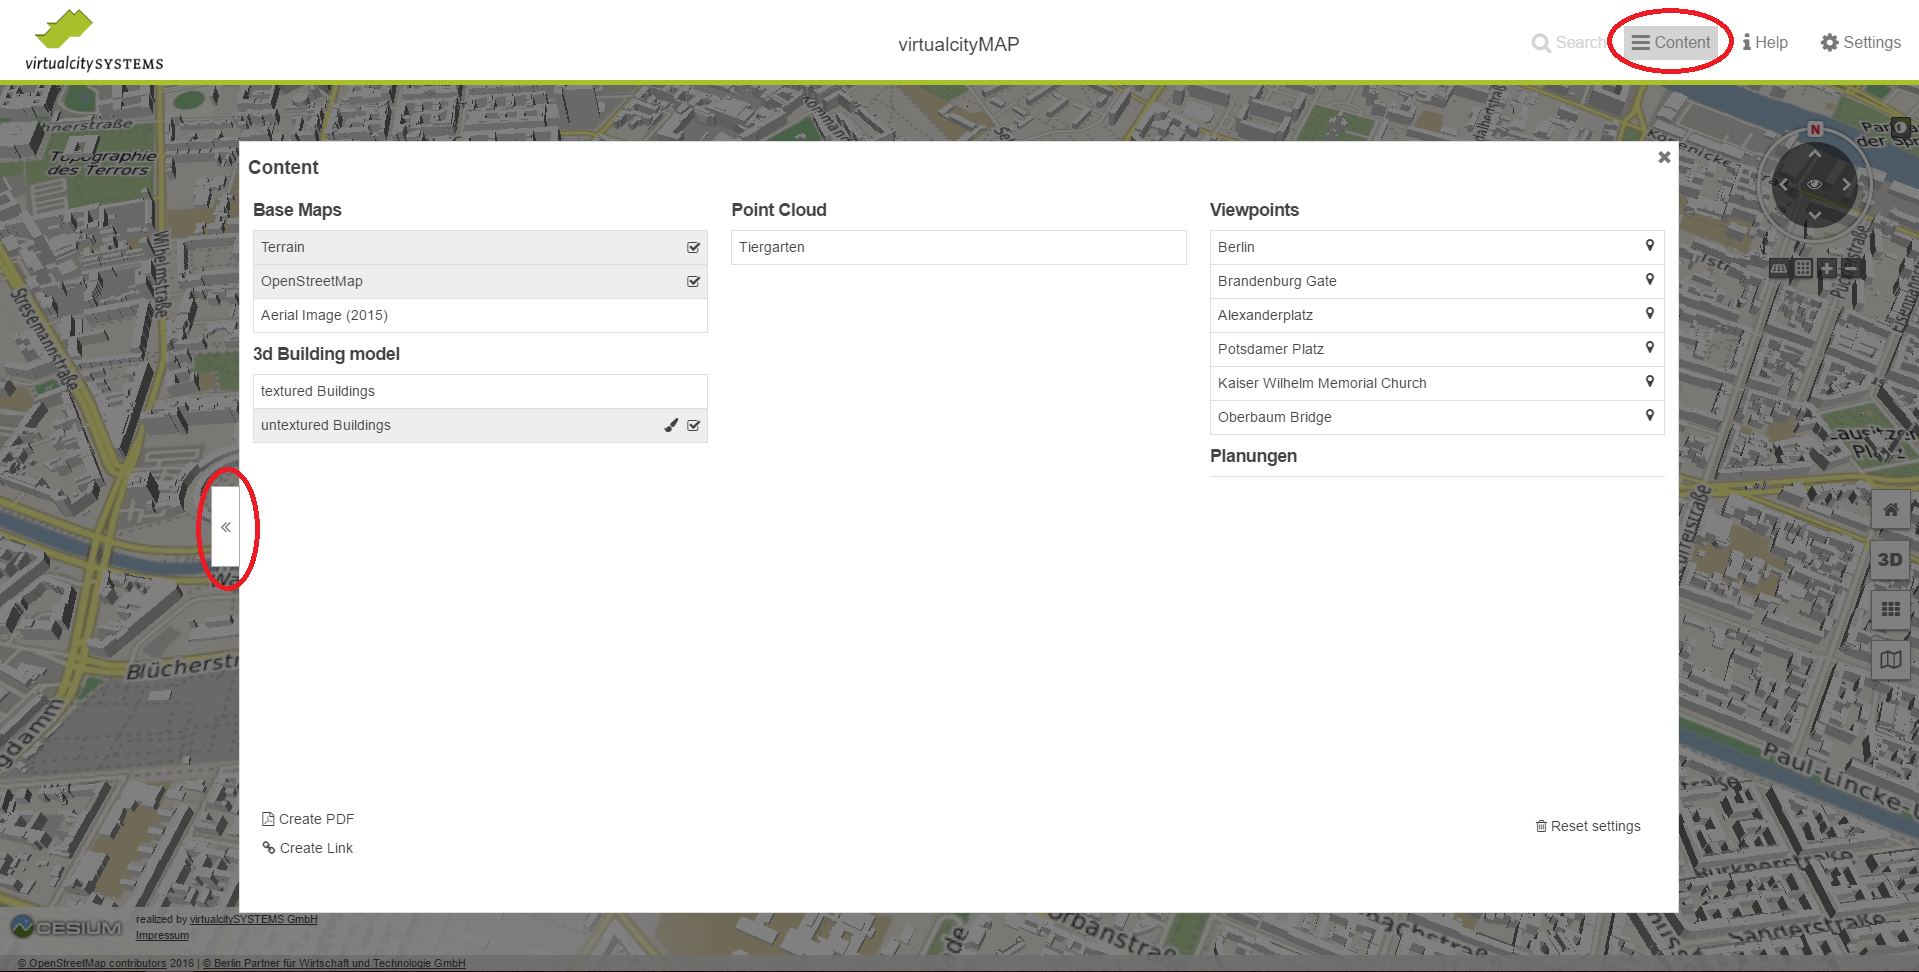
Content
A click on the 'Content' icon in the header of the application opens up a map key with thematically sorted
information. The map key allows to activate resp. deactivate layers and predefined view points. Depending on
the activated map view (2D, 3D, or oblique) it may be possible to activate resp. deactivate different layers.
The filter menu can be moved from the center to left side of the application and vice versa by clicking the
arrow symbol. It is possible to navigate in the map only if the filter menu is located on the left side of the
application.
Additionally, the filter menu provides the following functions:
-
Create PDF
This function allows to save the current map extract with the current markers and information as a PDF file.
-
Create Link
This function allows to create a link pointing to the current map extract with the activated layers. A click
on the 'copy' symbol left to the link copies the link into the clipboard.
-
Reset filter and settings
Resets all changes made in the filter menu.
Search Function
If the search plugin was added to the virtualcityMAP, it is possible to look for addresses or key words. The
search box may support the user by providing suggestions (e.g. key words, company or street names) to complete
the query.
Shadow
Shadow
The shadow widget appears next to the navigation control. A click onto the icon activates the shadow on the
map and opens a slider to change the day time.
A click on the shadow settings button opens up a menu to select the exact date and daytime of the simulated
shadow.
3D Object Query
With the 3D Object Query widget of the virtualcityMAP, it is possible to search for 3D objects in the
underlying database via a Web Feature Service (WFS).
The Query Widget can be found within the Control Elements inside the Widget Collection.
If predefined queries are available these can be selected in the drop-down menu. In addition, it is possible
to define free queries. In order to do this, an object type (e.g. _CityObject, Building, Bridge, etc.) to be
searched for needs to be selected first. Moreover, it is possible to add attribute and/or geometry filters to
the query.
The attribute filter
allows to specify the query in more detail with attributes corresponding to the selected object type. An
attribute filter consists of an attribute, an operator, and a value. The available operators depend on the
attribute's data type.
-
The operator of a numerical attribute (e.g. bldg:yearOfConstruction) may be greater, smaller, (not) equal,
or an interval query.
-
The operator of a string attribute may be (not) equal or like.
-
If a generic attribute is selected the attribute's name needs to be provided, too.
The geometry filter
allows to constrain the query spatially. A geometry filter consists of an operator, a geometry and possibly a
distance. The available operators are intersects, within, anddwithin.
-
If intersects is selected, the query will look for all objects intersecting with the
defined geometry (and matching the attribute filter).
-
If within is selected, the query will look for objects within the defined geometry.
-
If dwithin is selected, the query will look for objects that are within the defined distance to the
geometry.
It is possible to define the following geometry types: point, line, polygon, bounding box (rectangle). By
clicking the 'X' symbol an already defined geometry can be deleted.
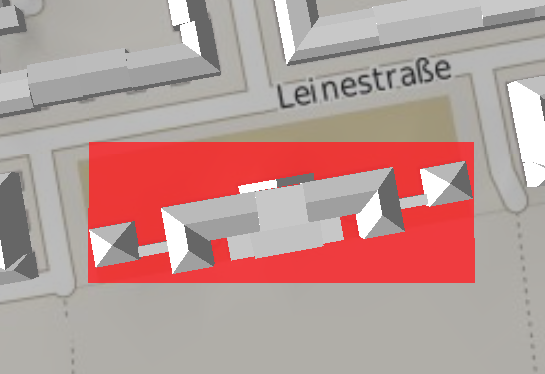 Important:
The geometry filter does not refer to the actual object geometry but its bounding box. The bounding box is
a (imaginary) rectangle, which completely encloses the object in the north direction of view.
The figure beside shows an example.
Combination filters allow the two filters to be interleaved. It is also possible to nest the combined
query with other combined queries. The queries can thus be designed as complex as desired.
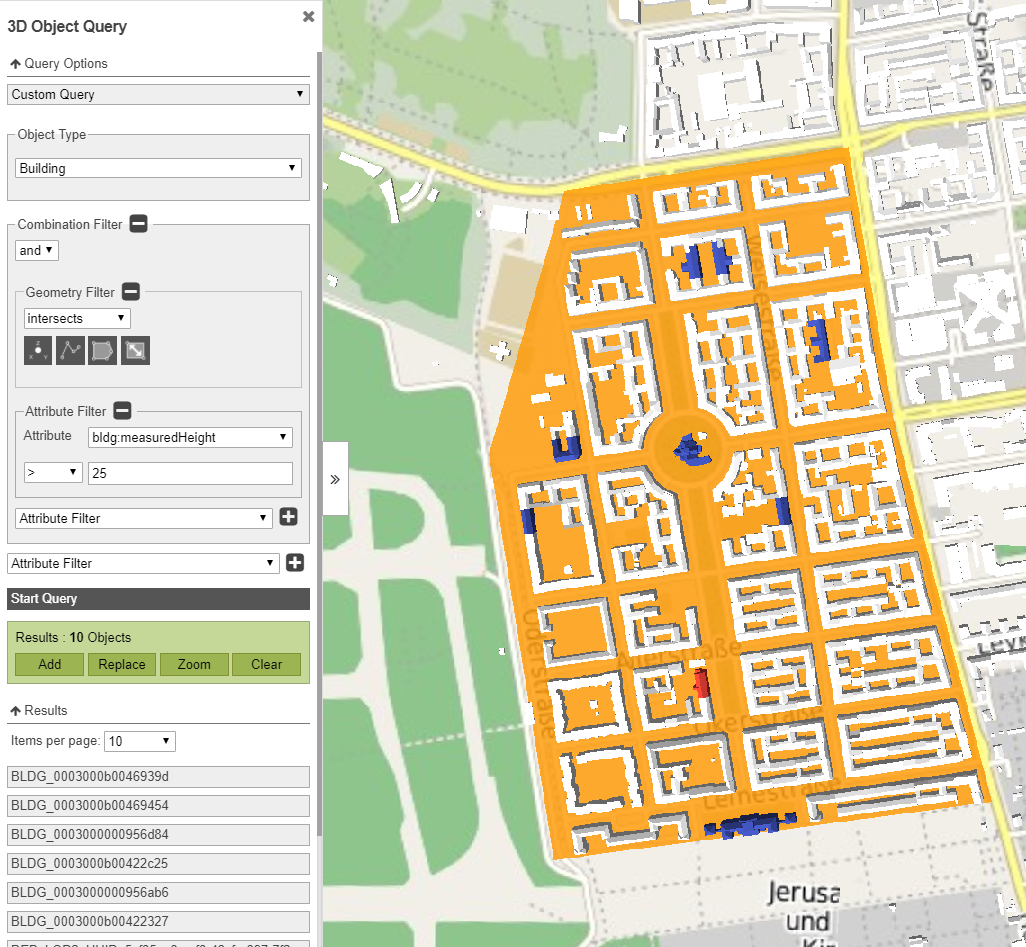
Sample question: "Which buildings in Schillerkiez have a building height of more than 25 m2"
Attribute filter: bldg: measuredHeight > 25
Geometry filter: Polygon drawn around the Schillerkiez
By clicking 'Start Query' the defined query is sent to the WFS. If the query was processed successfully, the
number of objects matching the filter conditions will be displayed. The user is able to add the objects to the
map (colouring the found objects), to replace objects found in previous queries by these ones, to zoom to the
found objects, and to clear the colouring resp. selection of buildings. The affected objects are listed below
and can be selected individually. Click on an object in the list to zoom on the corresponding model.
The following figure shows the result of a query of buildings with the "bldg: measuredHeight> 25" attribute
that intersects the defined polygon (orange). It can be seen that ten buildings correspond to the defined
filters.
PDF Export
A PDF of the application can be created in the widget menu or under Contents, which contains the current view
and, depending on the configuration, can be enriched with additional information in the backend.
Please note that the section is created independently of the screen/window size. Instead, it is created in
16:9 format starting from the center of the view. Therefore, it is possible that the view of the resulting PDF
differs from the displayed view.

For the Paper Size, the DIN sizes A5 to A2 can be selected.
The DPI (Dots Per Inch) number determines the resolution of the map section. Please note that a value
of 4096 x 4096 pixels (Internet Explorer 2048 x 2048 pixels) cannot be exceeded. Means, for example, that a
set page size of A2 landscape format in combination with 600 dpi cannot be output. Instead, the highest
possible resolution level is used.
Both the format and the DPI number have an influence on the resulting size of the PDF and on the creation time.
The Orientation can be chosen between portrait and landscape format. The size of the image is
correspondingly smaller when the portrait format is used.
The pixel size resulting from the default setting (portrait, A4, 300 dpi) is 2055 x 933 pixel.
The combined setting landscape, A4 and 300 dpi results in a size of 3402 x 1370 pixel.
If a Title Input Field has been configured in the backend, any title can be entered here. If this is
left empty, the title of the application is used.
If an Annotation Field has been configured in the backend, annotations can be entered in this field.
By clicking the Create PDF button, a PDF is directly created and downloaded and named map.pdf.
Export
With the Export widget of the virtualcityMAP, it is possible to export 3D objects from the underlying
database.
There are two options in order to select the objects that shall be exported:
Object selection and
area selection. Object selection means that objects are selected directly, e.g. as a result of a 3D
object query or by mouse clicks, use Ctrl + Left Click to add or remove buildings to your selection. The area
selection allows the user to select the objects to be exported based on a spatial extent. For that, a geometry
(polygon or bounding box) needs to be defined. The objects whose centre points are contained within this
geometry will be exported. The user is also able to upload a geojson file or export the selection shape after
drawing.
As the export process can take several hours, the user needs to provide an email address. When the export
process is finished a download URL pointing to the exported data will be sent to this email address.
Some additional settings need to be provided: Export format, LoD level, and thematic CityGML classes.
Depending on the selected format textures may be available. The CityGML format supports all top level CityGML
thematic classes for export, however, other formats are limited. A click on 'Send request' will start the
export process.
The following figure shows an example definition of an export process in which eight buildings are selected.
As the export format CityGML, as LoD level LoD 3, and as thematic classes Building as
well as GenericCityObject are selected. The objects will be exported with textures (appearance theme:
rgbTexture).
Should your export not contain the expected objects, please contact the 3D Maps administrator for guidance.
Drawing tools
General information
The drawing widget allows the user to draw simple as well as complex objects in the context of the environment
model. It can be activated by clicking on the icon shown in the widget selection.
The drawing widget is divided into three areas. In the upper part the different drawing modes can be selected
via the corresponding buttons. The buttons for object modification, transformation or import/export interface
are located directly below. Below the buttons are the tabs where the settings for the different styles and
manifestations can be set.
Drawing objects
Objects can be drawn in different ways. Besides the "classic" geometry types like point, line and polygon the
drawing of bounding boxes, circles and rectangles is supported. The drawing mode for the desired geometry type
is set via the corresponding selection in the upper part of the drawing widget.
Points are set by simply clicking on the desired position on the map. A line is drawn by setting its
supporting points. To close the line, the last fulcrum is set with a double-click. Alternatively, the drawing
can be stopped by clicking the hook button. A polygon is drawn similar to a line. However, if the last polygon
point is set, the polygon is automatically closed by a line to the first polygon point.
Circles are drawn by setting a circle center point in a first click and an additional second point indicating
the radius. Bounding boxes are created by setting the upper left and lower right corners. They are always
oriented to the north. Rectangles with any orientation can be drawn by three points. The first two points
indicate the direction. The third point can be used to define the width of the rectangle based on this
"baseline". Text labels are positioned by setting a point in the map.
Point

Line

Polygon

Bounding Box / Rectangle

Circle

Text lable

Altitude mode
Two height modes are available for drawing objects, which can be selected via the radio buttons. In the
"Ground level" mode, the objects are drawn directly on the terrain. In "Absolute" mode, objects
can be drawn on existing objects.

Edit and Transform Objects
 Two modes are available for editing objects. The "Hand button" takes you to the mode for moving and
transforming objects. The second button takes you to the mode for editing objects. After a mode has been
selected, objects can be selected in the map and edited according to the functions of the mode.
Two modes are available for editing objects. The "Hand button" takes you to the mode for moving and
transforming objects. The second button takes you to the mode for editing objects. After a mode has been
selected, objects can be selected in the map and edited according to the functions of the mode.
The individual functions of the modes are described below:
Move and Transform

Edit

Extrusion
In order to generate solid bodies from flat objects, these can be extruded at any height. To do this, an
object is selected in edit mode. The button for specifying the extrusion height appears.
In some cases it can be useful for visualization purposes not only to extrude objects in height, but also to
extend them in depth. Especially on steep slopes "floating" buildings can be avoided.
The extrusion depth can be edited by altering the height of the "skirt".
All objects can also be placed on the terrain.
Import / Export
Drawn objects are only valid for the current browser session. To persist these, objects can be exported in
GeoJSON format and then re-imported. It is possible to export only the currently selected objects or all
drawn objects.
Styles (texture, line, font, point)
The appearance of the geometries can be set before drawing. Geometries can subsequently be changed in the
editing mode.
Texture Style

In the "Texture Style" tab you can determine the opacity color and the opacity of the areas. In addition to
predefined basic maps, any color tone can be selected via RGB values.
Lines Style

For line geometries, line thickness can be specified in addition to line color and opacity.
Text Formatting

Text labels can be created in different fonts and sizes. The text can be displayed in bold,
italic or normal. The text color and its opacity can also be defined individually.
It is possible to surround the text with aborder. This can be activated or deactivated by pressing the
"Remove text border" button. A choice of colours is also possible here.
Point Style

For points, the desired radius, fill color and line border color can be determined. Optionally the line border
can be set. The "Select Icon" button can be used to use predefined symbols as point markers.
Planning
 The Planning widget allows to upload planning models into the virtualcityMAP. In conjunction with the
Shadow widget it is possible to simulate the shadow of planning models.
The Planning widget allows to upload planning models into the virtualcityMAP. In conjunction with the
Shadow widget it is possible to simulate the shadow of planning models.
In order to use the planning widget the user needs to authenticate with a valid username and password. The
user credentials are defined in the administration area of the planning widget. When logged in, the user will
see an overview of existing projects to which the user has access to. In addition, it is possible to create
new projects. In order to create a new project a project name needs to be given. Optionally, a project
description can be given. Moreover, when a user is logged in, a 'Logout' button appears in the top-right
corner of the virtualcityMAP. The button allows to logout of the planning widget.

A click onto the project's name in the left column allows to edit the project.
It is possible to change the access permissions, to edit the project description, and to delete the project.
When the pen symbol was clicked, it is possible to work with the project.
These functions are explained below.
The currently activated button is highlighted in green.
Back to the project list
By selecting the first button, you return to the project list.
Show available objects
It is possible to add new 3D models to the virtualcityMAP as well as to edit or delete models from the
project. A new 3D object can be added by clicking the corresponding button. This opens up a file browser
window, in order to select a file containing the 3D object that shall be uploaded. The upload process will be
started automatically after clicking 'open'. At the moment the planning widgets supports glTF, glb, COLLADA,
zip, and KMZ files.
When clicking the 3D object's name the map view will be centered at this object. A click onto the waste bin
symbol deletes the object from the project. The 3D object can be edited after clicking the pen symbol.
Hide objects
The planning module of the map allows users to hide 3D objects of the map context during planning. Trees,
buildings, etc. can be virtually removed for planning purposes. Thus the planning can be realized in existing
buildings and after "virtual demolition".
Hidden objects are displayed in a list with their IDs. A click on the eye next to the ID shows the object in
the map again and deletes it from the list of objects to be hidden. If you move the mouse over the object list,
the hidden objects are temporarily displayed in the map and provided with a red highlight style.
Create camera flight
With this tool you can create virtual sightseeing flights inside the Planning module and play them in the
application, or export them as GeoJSON.
Detailed instructions for creating a flight can be found in the section of the corresponding widget for
creating virtual sightseeing flights.
Create Viewpoint
The ability to create viewpoints in the Planner environment allows the user to define different viewpoints in
the context of projects.
These viewpoints are displayed next to the vector levels and flights in the legend. In addition, the views
defined here can be used, for example, in the flight widget to reach the predefined points.
By clicking on "Create new viewpoint", the respective viewpoint at which the user is currently located is used.
The editing the name and the fine adjustment of the viewpoint can be done by clicking on the pen symbol.
By activating the pedestrian mode, minor changes to the viewing angle can be made. The name and angle changes
can be applied or discarded by clicking on the buttons next to the pedestrian mode button.
With a click on the star symbol at the viewpoint you can define to which viewpoint the virtualcityMAP jumps
when you click on the parent project.
The planner's comment function allows you to mark planning locations and share important information between
users. This can be processing statuses or similar.
Each comment contains a title and an individual description by the author. The metadata of the comment are
author, date and time. The position of the comment is represented by a colored marker.
 The description as well as the title are displayed in the balloon. Author, date and time are represented in
the footer of the balloon.
Changes made by a user are also presented in the footer, indicated by the addition "Edited" and the date/time
of editing.
The description as well as the title are displayed in the balloon. Author, date and time are represented in
the footer of the balloon.
Changes made by a user are also presented in the footer, indicated by the addition "Edited" and the date/time
of editing.
The filter dropdown and selection menus can be used to show comments based on users and comment marker. Thus a selection for
individual user comments or planning stages is possible.
If the user has the appropriate permissions (which can be set in the backend of virtualcityPLANNER) to share,
the planning can be shared with other users. This allows other users to create comments and place them on the
map. In a shared plan, all comments are then visible to all other users with whom the plan was shared.
Edit a comment:
Clicking on the pen opens the editing window. The title, description, position and color of the marker /
comment can be changed here by an authorized user.
Move a marker:
"ALT" + left mouse button drag the marker to the desired position.
Color change of a marker:

Selection of another marker from the bar of available markers and saving the changes.
Data Import / Export
Data can be imported on planning and layer level by button or drag&drop.
 An import on planning level causes a corresponding level to be created for each imported file. Layers
in this sense are vector, raster and 3D object layers.
An import on planning level causes a corresponding level to be created for each imported file. Layers
in this sense are vector, raster and 3D object layers.
Import formats:
The following formats can be imported natively into a planning instance:
- GeoJSON
- Shape as ZIP archive
- Collada files (DAE)
- KMZ
- GLTF / GLB
- GeoTIFF
- Other image formats like PNG, JPG
 An import on layer inside the layer editor is only possible for vector layers and integrates the imported
features into this layer.
An import on layer inside the layer editor is only possible for vector layers and integrates the imported
features into this layer.
Import formats:
- GeoJSON
- Shape as ZIP archive
Depending on the import format, the behavior of virtualcityPLANNER varies.
GeoJson & Shape files are georeferenced and are placed on the map accordingly. If there are no absolute
elevations in these formats, they are placed over the terrain (clamp to ground) of the map. If the attribute
olcs_extrudedHeight exists in the formats Shape / GeoJson, the objects are extruded and placed in the map.
KMZ, DAE and GLTF / GLB models are processed and have to be placed manually in the map. See section
„3D model editing“.
Raster formats are processed and stored under raster layers. With the exception of GeoTIFF, these must then be
placed manually in the map.
Export formats:
The virtualcityPLANNER allows you to export data at different locations.
Depending on the layer, the data can be exported as GeoJSON (vector layer) or GLTF /GLB (object layer).
Single objects (from the 3D object layer) are generally exported as GLB models.
Vector objects- or layers are generally exported as GeoJSON.
Export from the 3D object layer:
 Left Button: Download model as GLTF / GLB model
Right Button: Download VCS configuration file for integration into vcPUBLISHER (for experts only)
3D model editing
Once an object has been uploaded, you have the option to edit it in edit mode. An object description can then
be added. The buttons below have the following functions:
 The object can be placed at any point by clicking into the map
 Makes it possible to set the building on the terrain
 By clicking the magnifier symbol the camera zooms to the selected object.
 Allows you to move the object (in X, Y, and Z directions) and enter a scale factor
 Rotate and tilt the object
Layer Editor
Layer Editor General:
The functionalities of the Layer Editor in the Planning widget are essentially based on the Drawing widget of
the virtualcityMAP, but extend them by functionalities that additionally support the planning context. Thus
layer descriptions, feature descriptions, individual styling and much more can be realized quickly and easily.
Shape files, GeoTiff, Collada, GLTF & KMZ can be integrated effortlessly and thus considerably strengthen the
planning context.
The Layer Editor provides 3 modes for editing the layer and its objects/features:
 Create:
At the beginning you have to decide if you want to draw on ground level or in absolute mode on an existing or
self-drawn building. By default the drawing is done on the ground level. The absolute mode must be selected
for each drawn object.
Then click on one of the buttons in the upper row to define a geometry shape for drawing.
To create/draw an object, the same functions are available that are also used in the drawing mode/drawing
widget. A description of the functions can be found in the Drawing Tools section.
 Edit:
Edit:
Individual features can be selected in edit mode:
- Select Button
Here you can enter a name and a description for the selected feature.
- Edit Button
Editing of the support points and application of the different drawing styles
- Export Button
Export selected feature as json file
- Delete Button
Delete selected feature
- Confirm Button
Complete object processing
- Choice of style options (same as under Settings)
Drawing styles
 Settings:
Under this menu item, settings can be made that affect the entire layer.
-
Defining the layer name, entering a description for the layer
- Preset height mode for all features as well as their ski height and storey height
- Drawing styles
-
Using the Import feature, vector data sets that have already been saved can be added to the vector plane
and saved below it.
-
The Optimize layer creates a binary data set, which makes the vector layer more perfomant. This is only
really necessary for ~500 objects.
-
Pressing the download button downloads the complete vector layer as a GeoJSON file and thus all plans
contained in it.
How to create Camera Flights
With this tool you have the possibility to create virtual sightseeing flights, to use them in the application
or to export it as GeoJSON.
The settings for film creation can be activated via the button with the camera icon, which
can be found in the widget selection bar. Now the window "Create virtual sightseeing flight" opens on the left,
in which a new sightseeing flight can be created - or an already exported film can be imported again.

Create a new flight
You can edit your film using the two drop-down menus "Settings" and "Set flight path".
 Settings
Here you can …
- eassign a name for your sightseeing flight
- set the type of interpolation
- activate a circular trajectory
- set the total flight time
- hide and show the flightpath
Interpolation:

linear:
Displays the defined trajectory as a straight line.
spline:
Displays the specified trajectory as a curve. At least 3 viewpoints must be defined which are not on a line.
TIP: To be able to compare between the settings linear and spline, look at your flight path from the
corresponding height and switch between the two settings. While playing the movie you can switch between the
interpolation settings.
Circular Flightpath:
This function automatically creates an air route from the last to the first viewpoint so that the movie can be
played back circularly.

Flight time:
Here you can set a total playing time for the movie in seconds. This has an effect on the running time between
the viewpoints.
Hide and show the flightpath:
By activating this checkbox, the yellow markers for the set viewpoints and the flightpath are shown and
hidden. This also works while the movie is playing.
Set a flightpath
The drop-down menu "Jump to Viewpoint ..." takes you directly to a preset viewpoint and you can define it as
such via the button "Create new viewpoint". To define your own viewpoint, simply go to the desired view in the
map window and then click on "Create new viewpoint". An unlimited number of viewpoints can be set.
A set viewpoint is indicated by a yellow marker. The first time a viewpoint is set, the whole window is colored
transparent yellow. This is the camera view of your viewpoint. As soon as you zoom out a little from the set
view, the complete outline of the camera view of the viewpoint can be recognized.

To return to the camera view of the viewpoint, simply click on the button associated with the viewpoint.
Using the plus icon you can easily add a new viewpoint between two other viewpoints.
Editing viewpoints
The icon with the pencil next to the viewpoint opens the editing mode. Here you can give the viewpoints
separate names or fine tune the view.

A click on the pedestrian symbol in the upper right corner of the map window below the navigation rose opens
a selection of options for fine adjustment. The buttons with the angle symbol can be used to increase or
decrease the viewing angle and the arrow symbols can be used to change the height of the view. This can also
be set directly via the input window below.

After the selection has been made, it can be confirmed by clicking on the symbol with the tick or discarded
by clicking on the cross. This also confirms or rejects the entry of a name.
A click on the button with the trash bin deletes the corresponding viewpoint.
Export and Save
The created films can be exported as GeoJSON and then imported again at any time.
If the film is saved via the corresponding button, it will only be made available temporarily for this
session. As soon as the application is reloaded or the movie is closed, it is no longer available!
The created film sequences are listed on the home screen. A click on the corresponding button opens the
playbar. You can also edit or delete the film here.
If the "Cancel" button is clicked, it is again pointed out that the flight is invalid, i.e. not saved, and
this must be confirmed again. The process can also be cancelled here. By confirming with "OK" you reach the
home screen "Create virtual sightseeing flight". The film sequences already saved in this session are
available here.
Import film
With the button "Import film" the previously exported Json file can be imported again and the film is
directly available for playback or further processing.
The Measuring tool in general
 With the Measuring tool it is possible to measure directly in the virtualcityMAP. It can be activated, by
clicking the shown symbol.
With the Measuring tool it is possible to measure directly in the virtualcityMAP. It can be activated, by
clicking the shown symbol.
All tools of the measurement widget deliver as result the measured value related to the local coordinate
system of the map, independent of the global coordinate system used in the viewer. The measurement tool can be
provided in the Oblique, 2D and 3D maps. The tools vary depending on the map in which the measurement tool is
used.
Measurement objects or the coordinates of the measurement objects (point, line, polygon) are projected into
the local coordinate system of the application according to the map used (Oblique, 2D, 3D) and the measured
value is output according to this coordinate system.
Measurements can be completed by double-clicking the end point or by clicking the "End measurement" button.
In all measurement modes, the measurements performed and the associated geometry objects are retained,
even if a new measurement mode is selected.
Measurements and the associated measurement geometries can all be removed or deleted from the view by clicking
on the trash. Individual objects can be selected by mouse click on the measurement geometry and deleted
individually from the view with "Delete".
Deleted objects cannot be restored!
Selection of a measurement geometry:
Left mouse click on the corresponding geometry / measurement
Deselection of a measurement geometry:
Left mouse click somewhere in the map
Edit a measurement geometry:
Select the measurement geometry and then:
Measurement geometry before editing
Changed measuring geometry by adding 3 additional calibration points
Add a new node:
Click on the corresponding geometry to create a new node on the geometry.
Move a node:
"ALT" + drag with left mouse button to desired position
Vertical Shift of a vertex:
"CTRL" + drag by left mouse button to required position
Delete a vertex:
"Shift" + click on vertex to be deleted
(Important note: The measurement has to be finished before the delete operation!)
Measuring tool in the Oblique map
The Oblique map contains the measuring tools:
- Horizontal distance measurement
- Vertical distance measurement
A terrain model is assumed in the Oblique-map for the vertical distance measurement, if this is not available,
indicated measurements can only be interpreted as estimated values.
All output measured values refer to the local coordinate system of the application.
Measuring tool in the 2D map
The 2D map contains the measuring tools:
- Horizontal distance measurement
- Surface measurement
Multiple measurements are possible and the measured values together with the measurement geometry are retained.
Direct distance between two points
Line measurement as polyline
The distance measurement follows the principle of the Euclidean distance between two points in the plane or in
space and is, for example, the length of a distance measured with a ruler that connects these two points.
In two-dimensional space or in three-dimensional Euclidean space, the distance, distance or distance between
two points is the length of the shortest connection between these points. In Euclidean space, this is the
length of the straight line between the two points. The distance between two geometric objects is therefore
the length of the shortest connecting line between the two objects, i.e. the distance between the two nearest
points.
Area: 258.3m²
Umfang: 72.4m
The result of the area determination in 2D returns the area and the circumference of the drawn object related
to the local coordinate system of the map (here: EPSG:25833).
Measuring tool in the 3D map
The measuring tool of the 3D map includes the measuring tools of the 2D map and extends them by 3D measuring
tools, which make it possible to measure 3D objects.
2D Measuring Tools in the 3D Map
The description of "Measuring tool in the 2D map" applies, whereby it should be noted that in the
3D map the 2D measurements always follow the terrain, but the result ALWAYS refers to the
local coordinate system of the application.
Direct euclidean distance of two points in 3D considering the terrain
Area measurement in 2D under consideration of the terrain
3D measuring tools in the 3D map
The measuring tools in 3D are extended by the height measurement and allow to directly include 3D objects in
the measurement or to measure them directly.
The following measuring modes are possible with the 3D measuring tools:
Direct euclidean distance between two points in 3D considering the terrain and the 3D objects
Euclidean distance measurement on the 3D object
Area measurement on the 3D object
Area measurement on the 3D object up to the terrain
Height measurement on / with the 3D object up to the terrain
Height profile tool
The height profile tool allows the user to create a cross-section including height information between two
points in the 3D map.
The height profile is created with the button New Profile.
The resolution and thus the precision of the height profile can be adjusted. Please note that the lower the
resolution, the longer the calculation time of the profile. If the resolution is too low and the extension is
too large, an error message will appear.
Under the selection item "Reference surface" you can select whether the 3D elements are to be included in
the height profile or only the terrain is to be taken into account. The setting options can also be adjusted
after the profile has been created.
The start and end points of the height profile can be defined and then calculated with two separate clicks.
The profile can be moved later by selecting the green line in the map and clicking on the round symbol again.
Attention: Although the green line is set exactly to the 3D content, overhangs cannot be taken into
account in the height profile.
Detailed measurements can be made in the output height profile by selecting two points between which the
measurement is to be made:
Measurements taken can be replaced by selecting two other points or removed by pressing the
Delete Measurement Button.
In addition, the output height profile, including the measurements performed, can be saved as an image by
pressing the Download Button.
Extended Pedestrian Mode
The extended pedestrian mode allows the user to define a visual analysis between two freely selectable points.
After activating this mode, the first click on the map defines the start position and the second click
defines the view direction. This function can be used to find out, which objects a User is able to see from a
certain point of view.
This mode can be left by deactivating the symbol in Control-Elements or underneath the Navigation-Control.
Transparent Terrain Mode
 The transparent terrain mode allows the user to look in 3D view under the terrain, for example, to make
elements visible under the surface. Select the widget and position the box by clicking on the desired
location. Click again to move the box.
The transparent terrain mode allows the user to look in 3D view under the terrain, for example, to make
elements visible under the surface. Select the widget and position the box by clicking on the desired
location. Click again to move the box.
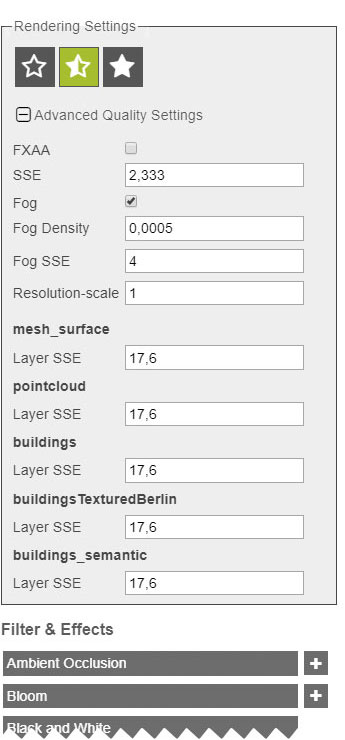
Filter and Effects
The possibility to apply filters and effects to the virtualcityMAP in 3D mode is provided under “Settings”.
The eight different filter modes can be activated individually or combined with other effects.
Adjustments to the default settings of the filters can be made directly next to the corresponding filter with
the button.
To deactivate this function please click again on the filter.
Navigation in the application
The 2D- as well the 3D-view allow to navigate in the map by using the mouse or the keyboard.
2D-Map View
| |
... by mouse |
... by keyboard |
| Map pan |
Left mouse click and pull map |
Press arrow keys to navigate to the corresponding direction |
| Zoom in / Zoom out |
Zoom in or out by spinning the mouse wheel |
Press plus or minus key |
3D-Map View
| |
... by mouse |
... by keyboard |
| Map pan |
Left mouse click and pull map |
Press arrow keys to navigate to the corresponding direction |
| Tilt view |
Press mouse wheel and move mouse front or back |
Press 'Page Up' resp. 'Page Down' key |
| Rotate view |
Press mouse wheel and move mouse to the left or right |
Press 'Home' resp. 'End' key |
| Zoom in / Zoom out |
Zoom in or out by spinning the mouse wheel |
Press plus or minus key |
Troubleshooting
Falls die 3D Karte in Ihrem Browser nicht lädt oder sehr langsam läuft: Mögliche Ursachen
Fehlende Hardwarebeschleunigung
Die Hardwarebeschleunigung Ihrer Grafikkarte wird nicht unterstützt – Das bedeutet, dass der Webbrowser auf
Softwarerendering umgeschaltet hat, somit ist eine performante Darstellung von 3D-Daten rein technisch
nicht möglich. Lösungsvorschlag: Über die Webseite http://webglreport.com/ können Sie die aktuelle
Browsereinstellung bezüglich Hardware- oder Softwarerendering testen.
Softwarerendering ist aktiv = 3D-Karte kann mit Ihrem Browser nicht verwendet werden.
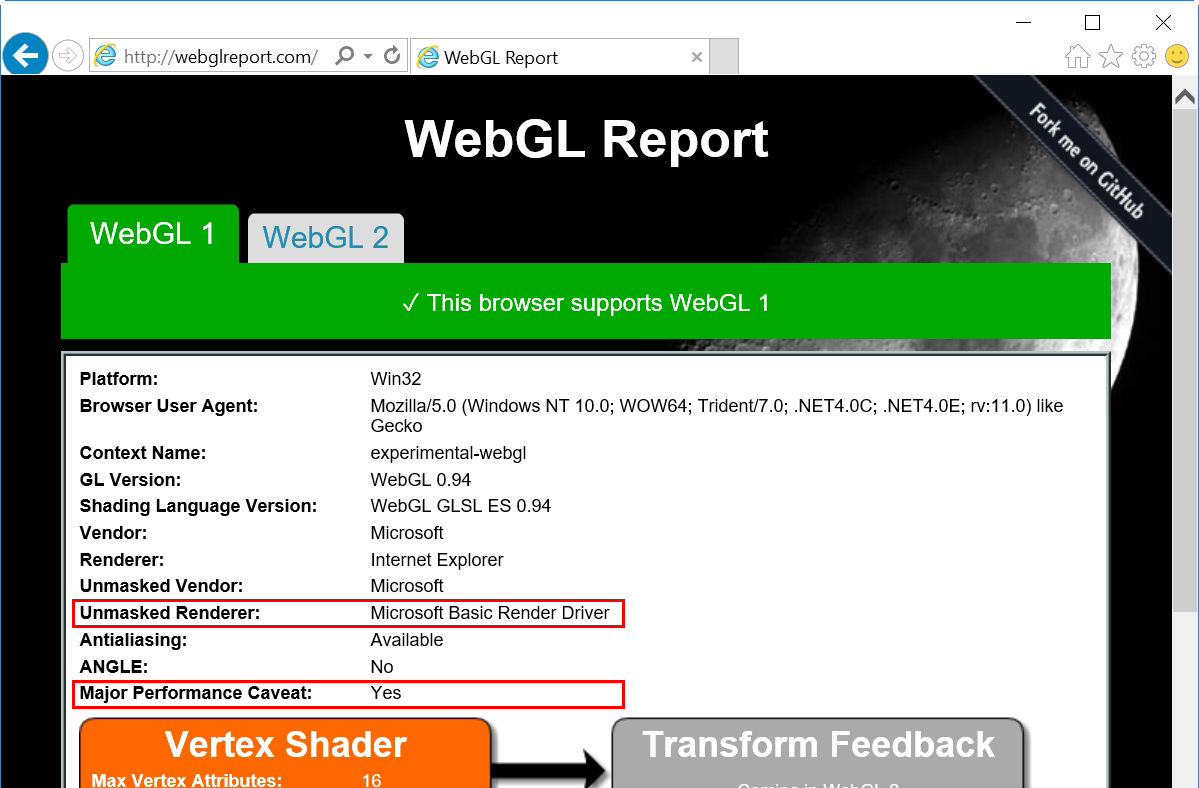
Hardwarerendering ist aktiv = 3D-Karte kann mit Ihrem Browser verwendet werden

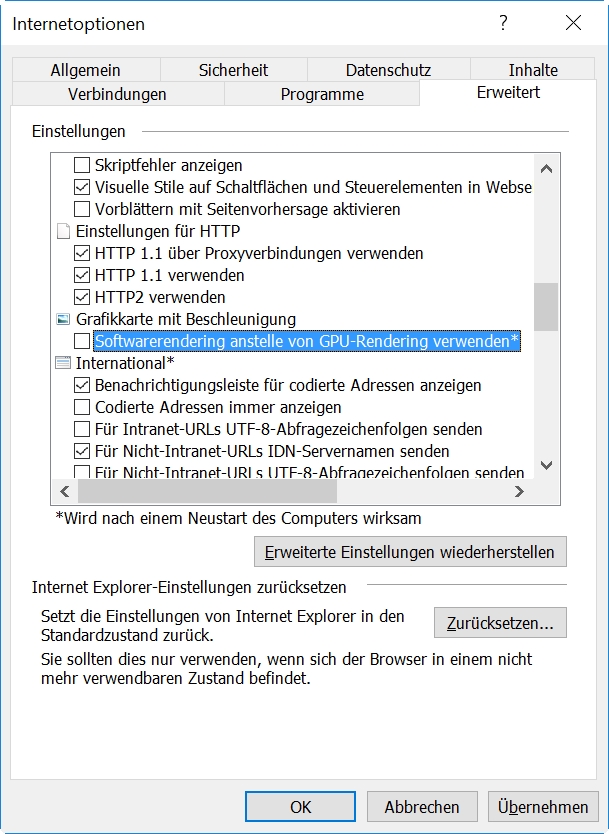
Grafiktreiber ist veraltet
Lösungsvorschlag: Bitte aktualisieren Sie Ihren Grafiktreiber und prüfen ob die Hardwareunterstützung
aktiviert ist.
Beispiel aus dem Internet Explorer 11: Einstellungen >> Internetoptionen >> Erweitert >> Softwarerendering
anstelle von GPU-Rendering verwenden. Ein Neustart des Browsers ist erforderlich.
Ihr Browser unterstützt kein WebGL
Lösungsvorschlag: Bitte verwenden Sie einen aktuellen Browser z.B. Firefox ab 51.x , Google Chrome ab 56.x,
Internet Explorer ab Version 11. Der Microsoft Edge ist ab Version 0.95 WebGL-fähig.