
Urban Visualization Platform
On this platform an overview of different visualizations for a variety of (3D) data is provided.
The examples shown here were created during different research projects at HFT Stuttgart (University of Applied Sciences Stuttgart).
Hexgrid 3D Tiles (15m)
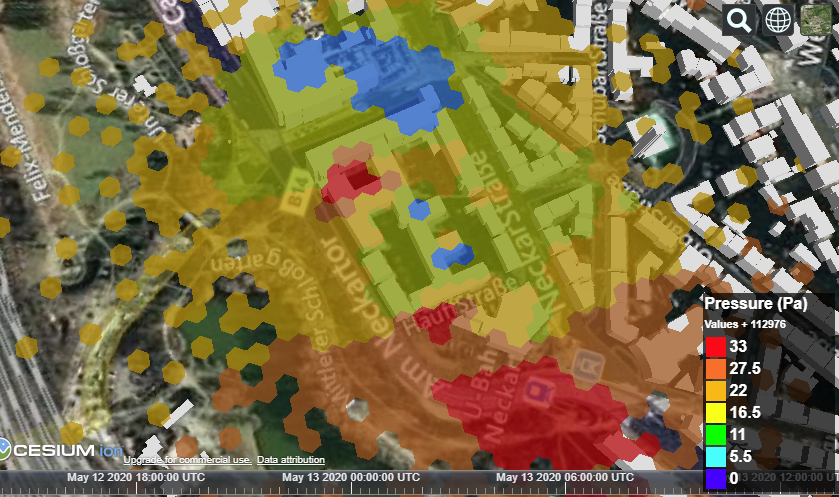
Wind pressure at roof top height, shown as a floating 3D Tiles hexgrid (hexagon width 15m).
Hexgrid 3D Tiles (2m)
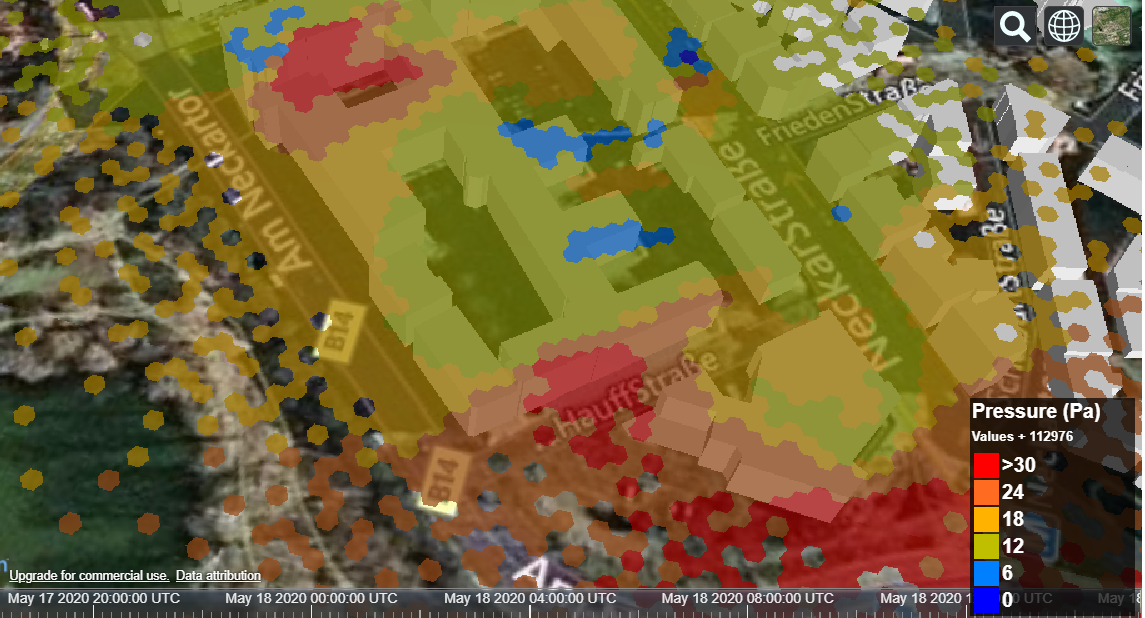
Wind pressure at roof top height, shown as a floating 3D Tiles Hexgrid (hexagon width 2m).
Hexgrid GeoJSON (5m)
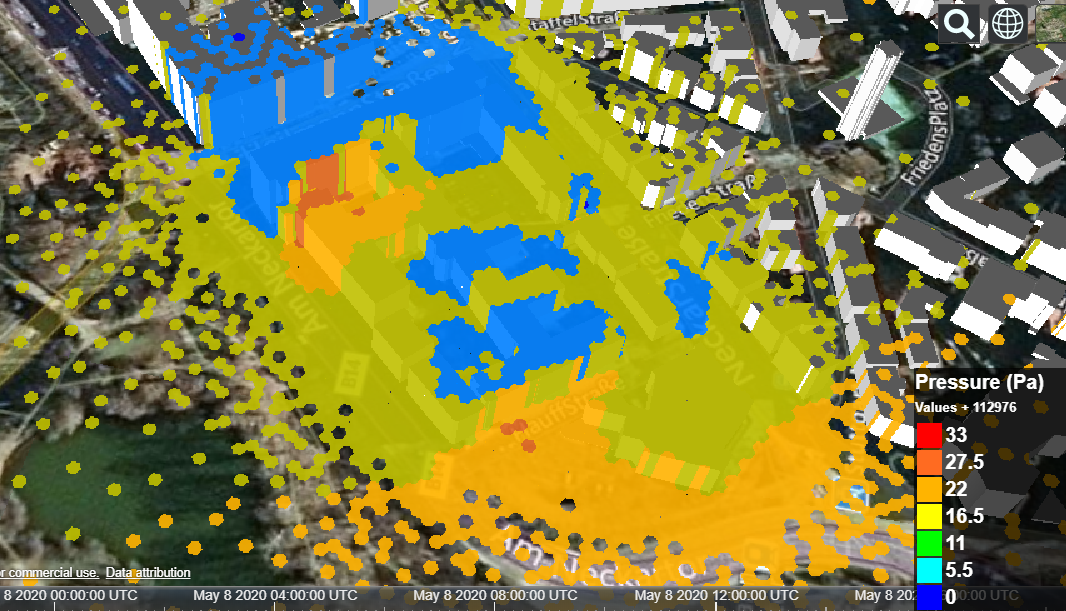
Wind pressure at roof top height, Hexgrid (hexagon width 5m) is clamped to ground and buildings.
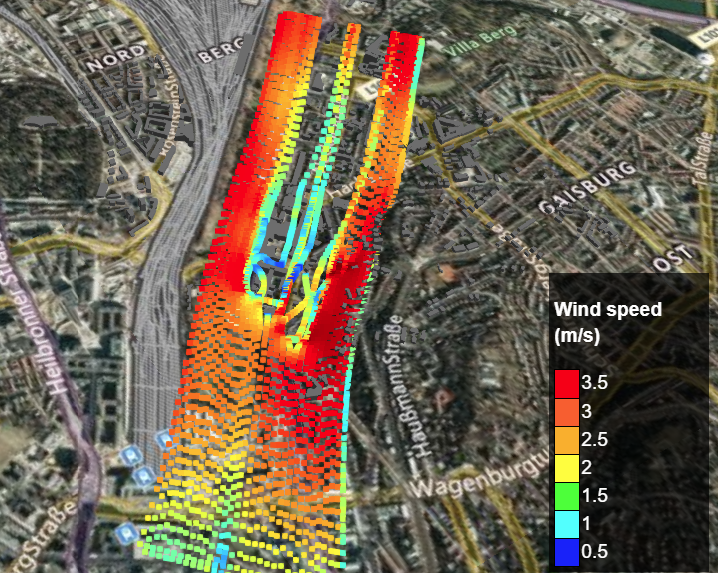
Pressure PointCloud (3D Tiles)
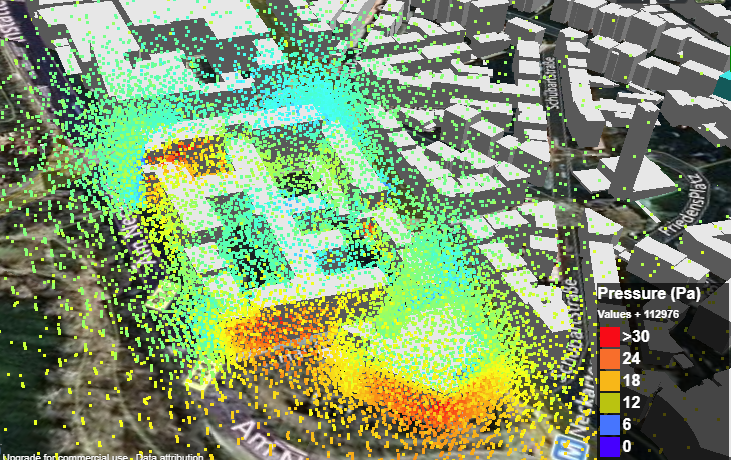
Wind pressure around a building block visualzied as a point cloud. Color represents different pressure values according to legend.
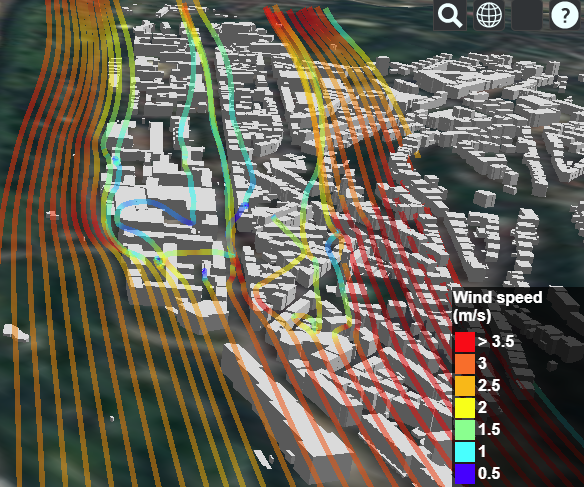
Streamlines (3D Tiles)
Streamlines showing wind flow over and around a building block and parts of Stoeckach. Wind speed is encoded as color information as of the legend.
Multi-Color/Part Streamlines
Wind speed around a building block visualzied using Cesium multicolor multi-part lines primitives. Color represents different wind speeds, values according to legend.
WindowDetection on Buildings
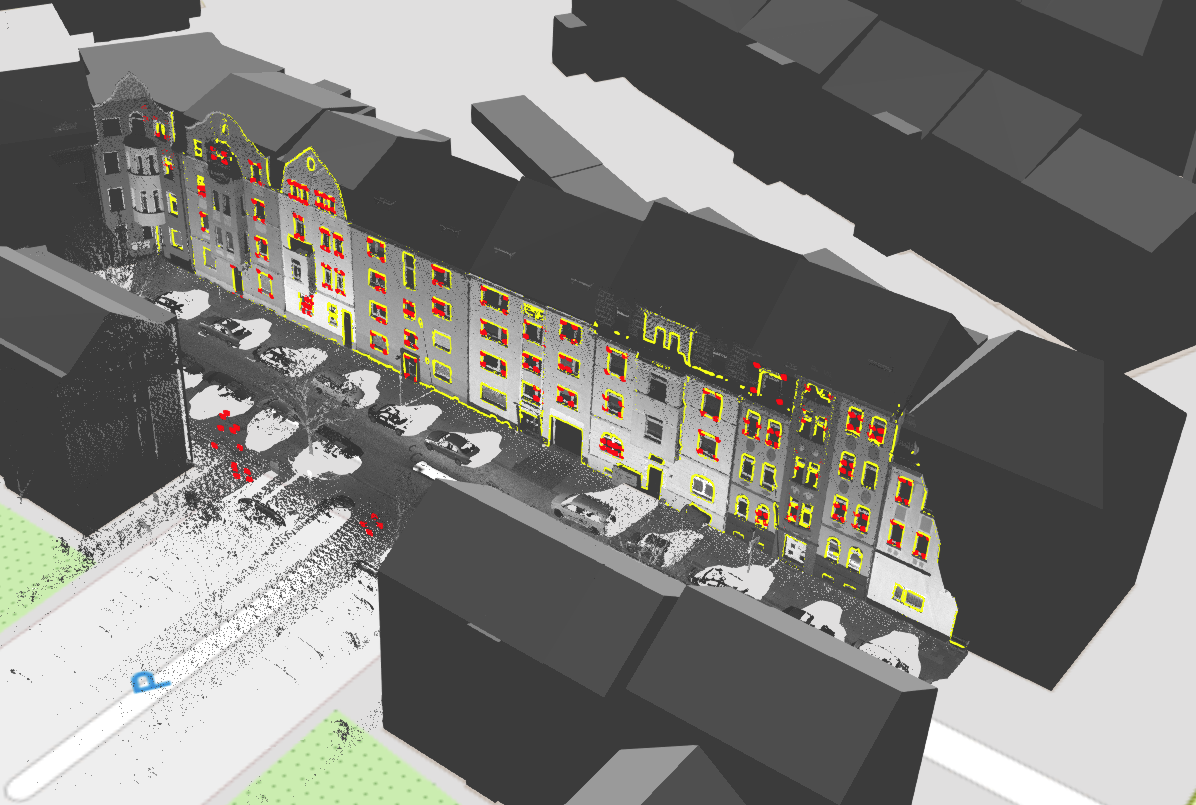
Showing results from automatic window detection from LiDaR point clouds. Results are shown on top of 3D building models and the original point cloud.