
Urban Visualization Platform
On this platform an overview of different visualizations for a variety of (3D) data is provided.
The examples shown here were mainly created during the iCity research projects at HFT Stuttgart (University of Applied Sciences Stuttgart).
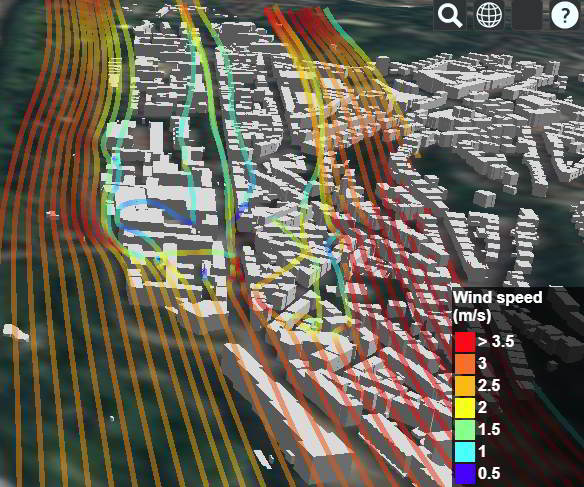
Wind in Stuttgart, Kernerviertel
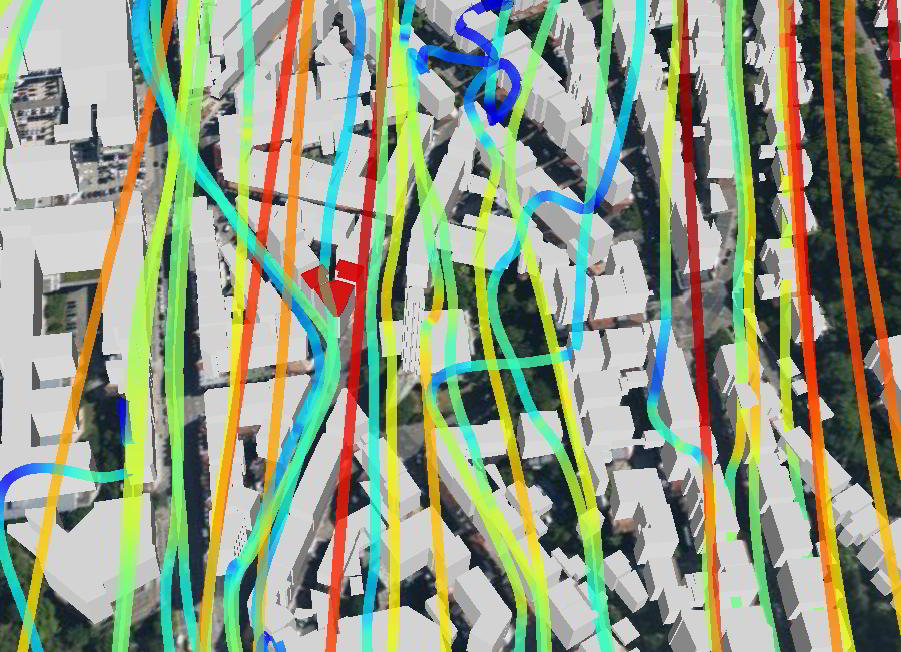
Visualisation of wind around three target buildings (red) near a church with spire and surrounded by numerous building layers (colors). The streamlines results from a Computational Fluid Dynamic simulation of the air flow with RANS (Reynold-Averaged Navier Stokes Equations) and the k-omega SST Turbulence model.
Wind in Stuttgart, Kernerviertel
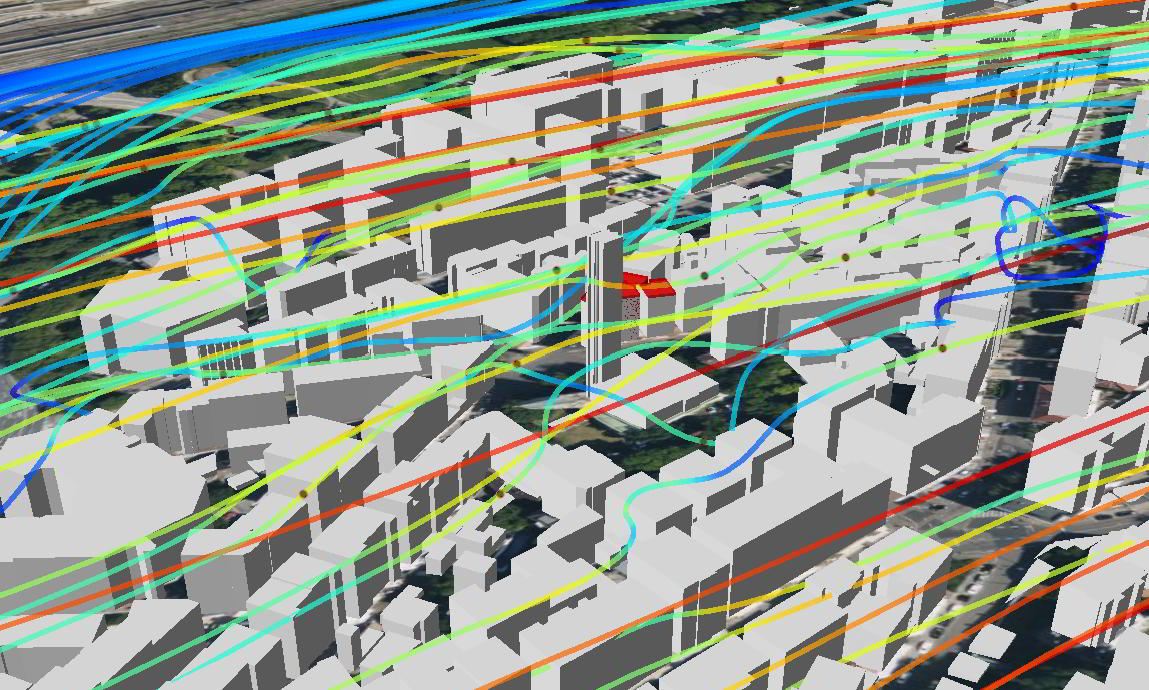
Wind visualisation with particles around three target buildings (red) near a church with spire and surrounded by numerous building layers (colors). The streamlines results from a Computational Fluid Dynamic simulation of the air flow with RANS (Reynold-Averaged Navier Stokes Equations) and the k-omega SST Turbulence model.
Wind in Stuttgart, Kernerviertel
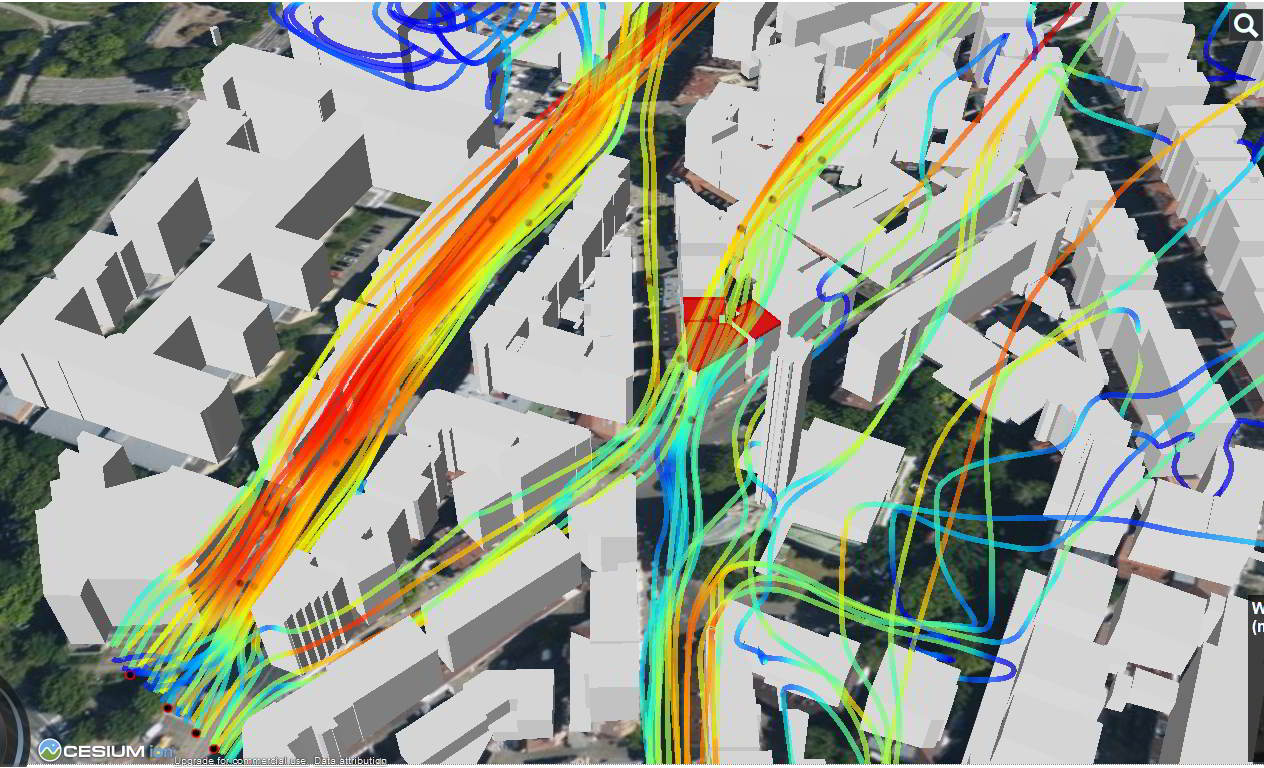
Wind visualisation with particles around three target buildings (red) near a church with spire and surrounded by numerous building layers (colors). The streamlines results from a Computational Fluid Dynamic simulation of the air flow with RANS (Reynold-Averaged Navier Stokes Equations) and the k-omega SST Turbulence model.
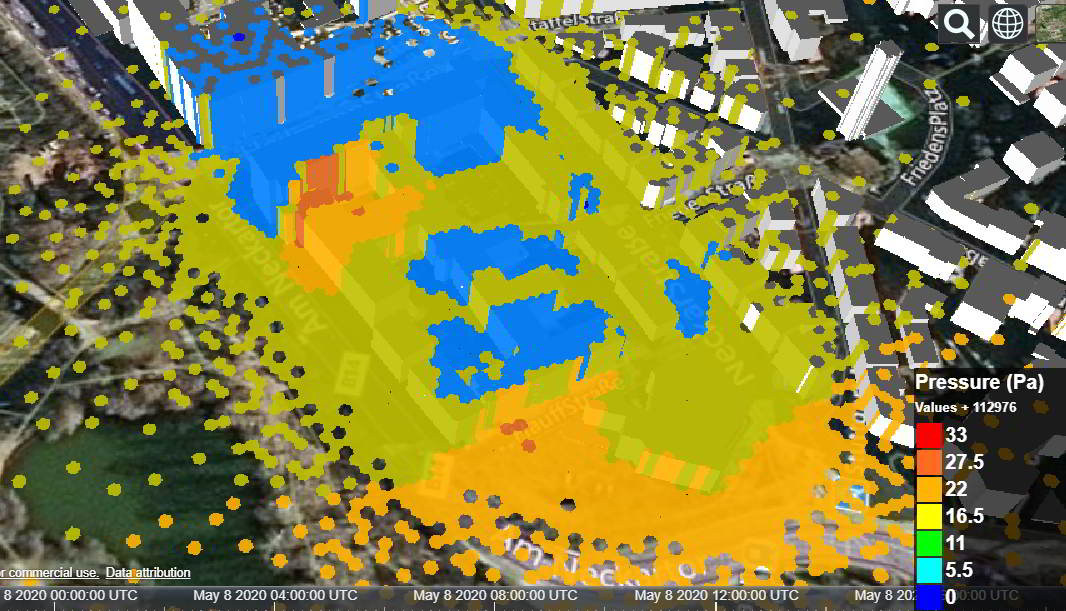
Pressure PointCloud (3D Tiles)
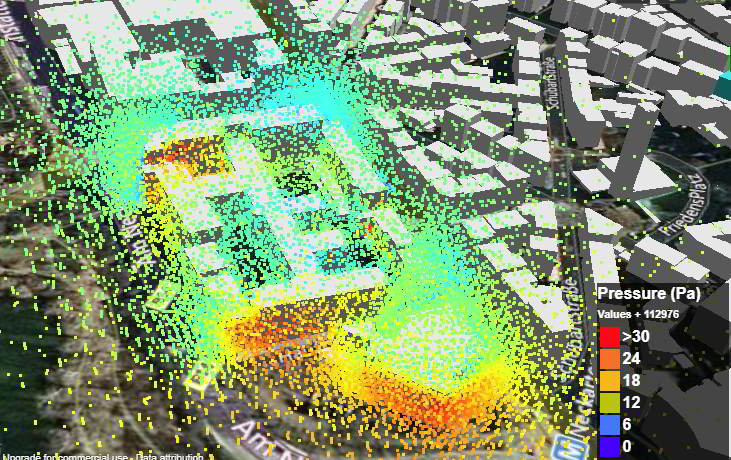
Wind pressure around a building block visualzied as a point cloud. Color represents different pressure values according to legend.
Streamlines with particles
Multipart streamlines with vertex coloring showing also particles moving along the streamslines in order to give a better impression of the wind field.
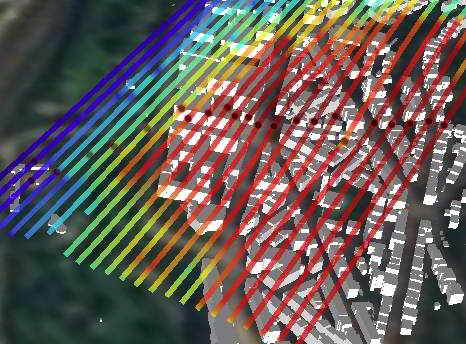
Multi-Color/Part Streamlines
Wind speed around a building block visualzied using Cesium multicolor multi-part lines primitives. Color represents different wind speeds, values according to legend.
Hexgrid GeoJSON (5m)
Wind pressure at roof top height, Hexgrid (hexagon width 5m) is clamped to ground and buildings.
Streamlines (3D Tiles)
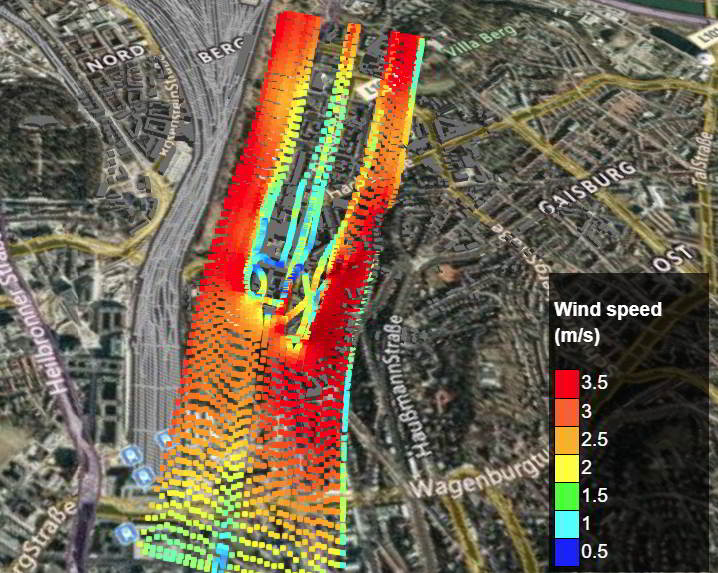
Streamlines showing wind flow over and around a building block and parts of Stoeckach. Wind speed is encoded as color information as of the legend.
Hexgrid 3D Tiles (2m)
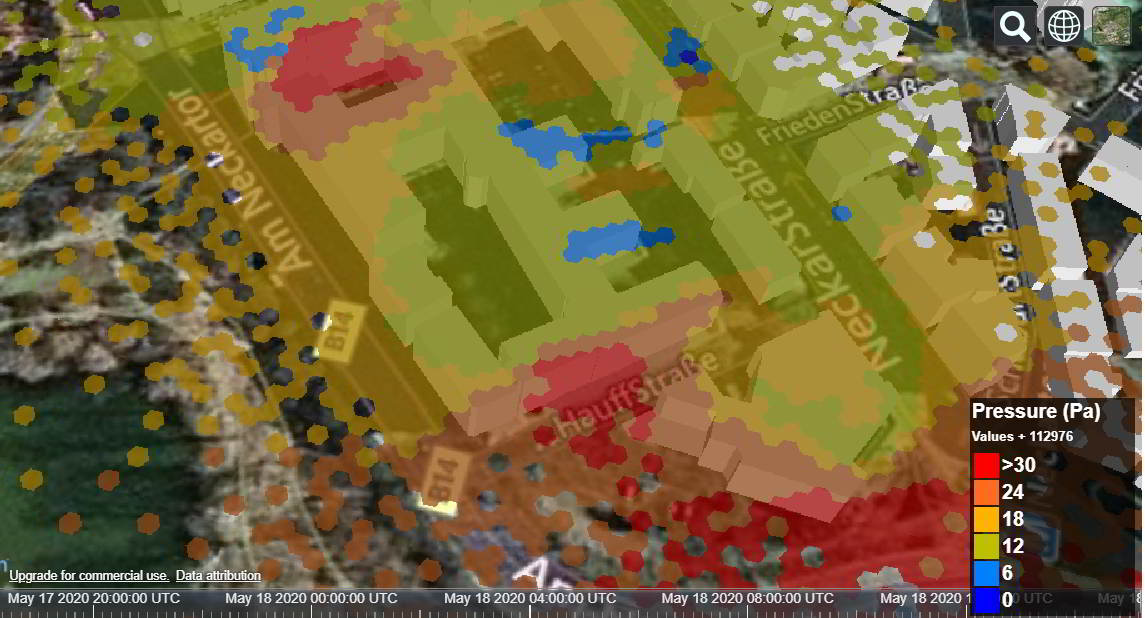
Wind pressure at roof top height, shown as a floating 3D Tiles Hexgrid (hexagon width 2m).
Hexgrid 3D Tiles (15m)
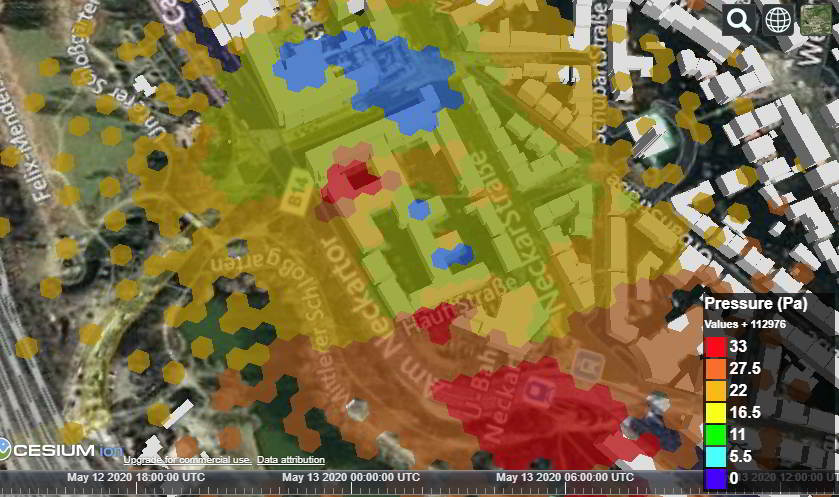
Wind pressure at roof top height, shown as a floating 3D Tiles hexgrid (hexagon width 15m).
WindowDetection on Buildings
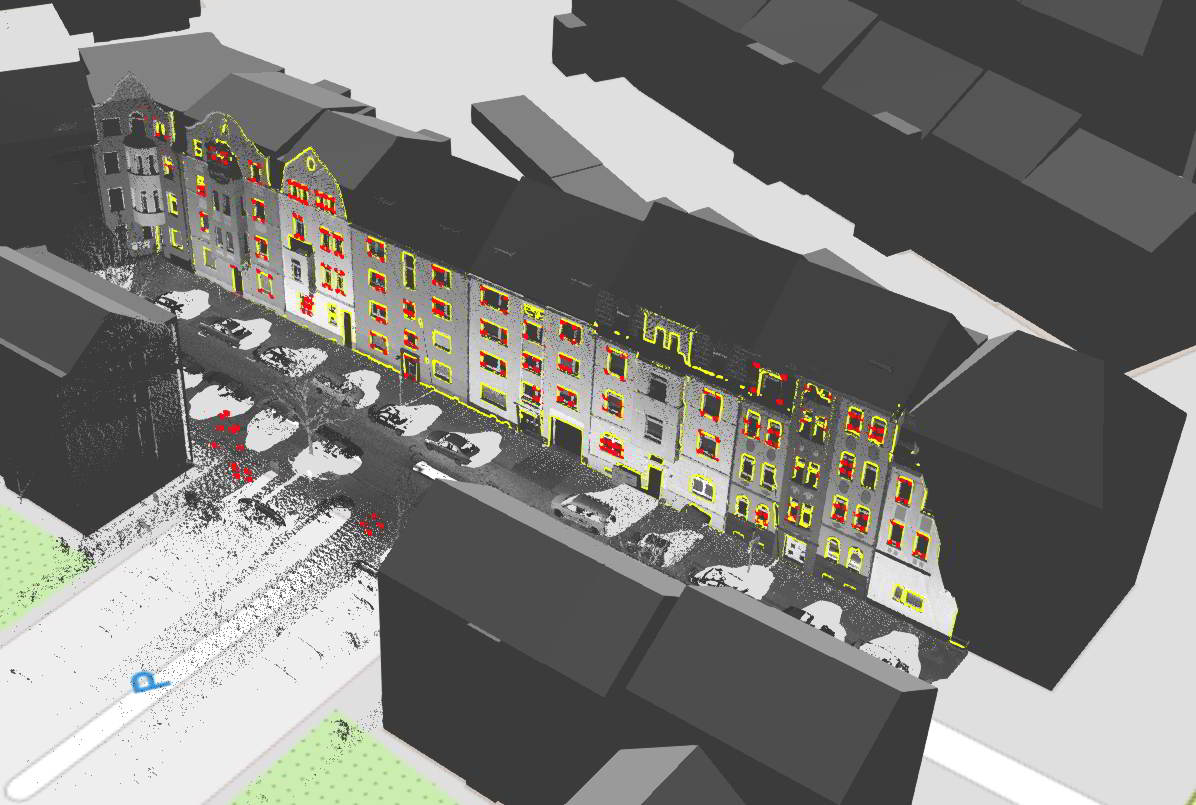
Showing results from automatic window detection from LiDaR point clouds. Results are shown on top of 3D building models and the original point cloud.