This work by Kai-Holger Brassel, Hamburg, is licensed under CC BY-NC-ND 4.0
![]()
![]()
![]()
![]()
Non-final version: April 8th, 2022.
Introduction
|
This introduction talks about the work of the author and others, but without bibliographic references. Currently, it is just meant as background to better understand the technical documentation in the sections to follow. Maybe it could be developed into a more serious paper later. |
Simulation of energy supply and consumption of buildings at the level of districts or even cities not only requires elaborated algorithms but also careful design of model structure and parameters. Structural aspects include building geometry as well as arrangement of buildings, e.g. to take shadowing and heat transfer into account. Assigning usage patterns or energy components like heat pumps, PV, boilers, etc. to specific buildings also count as structural aspects of a simulation model. Moreover, this multitude of model entities has to be defined in more detail by lots of numeric, ordinal or nominal parameters. Our experience with developing simulation systems like INSEL and SimStadt showed that manual parametrization based on informal data collections, typologies, spreadsheet tables, etc. from different sources is tedious and often hard to reproduce. Instead, parametrization of complex models should be supported by software providing formally defined parameter catalogs, that are systematically created and updated by domain experts.
Parameter catalogs and the software to create, maintain and deploy them should be independent of any specific simulation software to enhance software modularity (separation of concerns). Ideally, modelers can enhance their simulation environment by adding suited parameter catalogs as software plug-ins and use them to parametrize model entities easily, e.g. via drag and drop.
Automatic parametrization of components in simulation models requires a formal data model which fits the simulation models in terms of content and structure and can pass information to them. Self-contained parameter catalogs fulfill this requirement by providing an application programmers interface (API) that can be queried for automatic, rule-based parametrization of simulation models.
To get good results fast, close collaboration with domain experts and short development cycles are desirable. We achieved this by exploiting techniques of so called low code development. Basically this means that domain experts encode their knowledge into a graphical diagram defining types of components, their relations, and attributes. From this diagram, program code for storing and manipulating data sets in main memory as well as code to write and read that data to and from XML files (or data bases) are automatically generated. A modern graphical user interface to create, read, update, and delete data (CRUD operations) can also be provided with no or very few lines of manually written code.
The overall motivation for the work on parameter catalogs for simulation is to make easier to develop and perform computer simulations in complex and data rich domains like building physics, transportation, and all kinds of urban infrastructure.
The Bigger Picture
A good part of computer science was and is driven by the motivation to make it easier to develop computer programs of all sorts. "Higher" programming languages were invented to make programs human readable and soon special constructs for functional programming (computation without side effects) and structured programming (computation without go to statements) were introduced to help programmers writing and understanding ever growing programs. Then, between 1962 and 1967, program language Simula was developed especially to deal with the challenges of simulating systems comprising of many different types of objects. This opened the door to more direct computer representations of real world objects, their attributes, relationships and behavior, ultimately leading to object-oriented software development that today is embodied in programming languages like Java, C++, Python, and graphical notations like the Unified Modeling Language (UML).
While these achievements had boosted the productivity of software developers, still the creation of correct, efficient and maintainable programs — including simulations — required a big deal of expert knowledge and experience. To overcome this bottleneck, starting in the 70s, so called 4th generation languages entered the stage. These languages were tailored to specific tasks like statistics ("S" 1976, "R" being its successor), database programming (SQL 1979), or simulation (MATLAB around 1979, Mathematica 1988, Modellica 1999) to name a few. By sacrificing generality, these special languages become more accessible to domain experts, not just trained software developers. To flatten the learning curve even more, formal graphical languages for special purposes were invented, e.g. Simulink for block diagram simulation models in 1984, Entity-Relationship-Diagrams for data modeling in 1976, UML for object-oriented systems design in the 1990s, or graphical languages to specify business and also scientific workflows around 2000.
This very short history of technologies for development of software in general, and simulations in particular, shall illuminate the tools at our disposal:
-
general purpose programming languages that combine structured, functional and object-oriented approaches to enable the creation of big, modular software systems, often called "programming in the large"
-
formal textual domain specific languages (DSLs) dedicated to solve specific tasks with ease
-
formal graphical DSLs.
Note that DSLs more tend to describe what shall be achieved by a computation instead of describing in detail, how to achieve it. Therefore, DSLs usually look more like a model than like an algorithm.
Now back to the task at hand.
Some domains deal with a few types of simple objects to be simulated. Take the building blocks of an electric circuit as an example. The algorithms to simulate these correctly and efficiently may be quite complex — the model elements usually can be described by very few parameters like resistance or capacity. More complex domains like (regenerative) energy systems or building physics deal with more complex objects to be simulated, e.g. PV modules or layered walls of buildings, often coming in different types and configurations, and dozens of possibly interdependent parameters.
Lessons Learned
First a note on terminology: Instead of parameter catalogs in SimStadt we used term library like in building physics library. Obviously this was not a good choice, since library is used a lot in IT and programming with all sorts of meaning. Instead we started to talk about data catalogs, but in data science this term has specific meaning, namely: catalogs of data and data sources. Since our catalogs, first of all, shall grant structured access to parameters for simulated entities parameter catalog sounds more appropriate to me.
The problem of navigating huge parameter spaces and assembling complex simulation models popped up as the author worked on a diagram editor for INSEL, a simulation language and runtime environment developed for renewable energy systems simulation. To make existing catalogs on weather data, solar panels and inverter modules accessible to the modeler, special dialogs were added to the INSEL user interface that allowed browsing through the catalogs. Using this browsers, the modeler would choose a weather station, panel or inverter to parameterize a corresponding INSEL function-block. However, there are some severe disadvantages with this approach:
-
Parameter catalogs were stored in a proprietary data format on disk within the INSEL application distribution, meaning they could not used independently from INSEL by other interested parties (systems or users).
-
The catalogs have to be maintained by editing text files manually.
-
While INSEL modeler could browse the catalogs, searching and sorting were not supported.
-
Development of Java Swing UIs for the different kind of catalogs is time consuming as is their maintenance, e.g. if a catalog data format were to change.
-
Putting UIs to handle big amounts of data into a diagram editor is not very user friendly.
From 2013 to 2016, the simulation platform SimStadt was developed to make specific modeling and simulation workflows accessible to experts in urban planning and energy systems. Using INSEL and other simulators under the hood, the usage of 3D city data, provided as CityGML files, was a core requirement of this project.
To enable simulation of, say, the heating demand of a district, geometric building data had to be enriched with data on building physics and usage. To do so, existing informations about building physics and usage — often only available as informal typologies or tables — had to be provided to the SimStadt user on an abstract level, e.g. to choose between refurbishment scenarios. At the same time, specific building configurations and parameter sets had to be injected into the simulation models to obtain the desired results.
Again, we implemented parameter catalogs to fulfill these requirements, but compared to the quite simple catalogs used in INSEL, the data for building materials, window, wall and roof types as well as the typologies of buildings, households, usage patterns, and so on were more intricate. They had to be created iteratively in collaboration with domain experts. In this situation, manual coding data formats and access with a general programming language would have led to relatively long iteration cycles and high communication effort between programmer and domain expert. Instead, we decided to use a DSL for data modeling and use code generation whenever possible. Since SimStadt was developed within the Java eco-system we followed this standard approach:[1]
-
Developer and domain expert create a first version of the data model as XML Schema Definition (our DSL).
-
For plausibility checks one would use any standard XML editor to create example data conforming to the XSD.
-
With JAXB (Java Architecture for XML Binding) Java code is generated to read our XML catalogs into Java objects that, in turn, can be accessed by SimStadt workflows to generate and parameterize simulations.
-
If required, developer and domain expert go back to step one to refine data model and catalog data.
After the data model for building physics catalogs had matured, we developed a desktop application for convenient creation and maintenance of building physics data catalogs separate from SimStadt. It was developed in Java with a user interface written in JavaFX and was well received by domain experts.
However, as a different catalog — this time for building usages — had to be created, it was quite difficult to reuse the XML schema and application code from the building physics catalog: The usage catalog data model was "pressed" into a form similar to the building physics catalog data model, and the UI code was "over-engineered" to accommodate both catalog’s requirements.
Low-Code-Development of Parameter Catalogs
From INSEL and SimStadt we learned, that manual and automatic construction and parameterization of complex simulation models with many types of interrelated objects should be supported be the means of domain specific parameter catalogs.
Close collaboration with domain experts in designing and implementing these catalogs in short development cycles is desirable.
Parameter catalogs and the software for their creation, maintenance and deployment should be independent of any specific simulation software, (a) to be reusable and (b) not to overload simulation applications.
In SimStadt, catalog development was partly facilitated by a textual DSL for data modeling (XML schema language) and automatic generation of Java code from it. On the other hand, user interfaces and generation and parameterization of simulations from templates within SimStadt workflows had still to be coded manually hindering the routinely creation of new catalogs.
Now, in 2020, several developments in different projects provide an opportunity to re-think the topic of parameter catalogs for simulations, namely:
-
Plans for a new Urban Simulation Platform at Concordia University, Montreal.
-
New implementation of INSEL user interface based on the Eclipse application framework and Eclipse-Sirius diagram editors.
-
Enhancement of existing building physics and usage catalogs from SimStadt and their adaptation to new regions.
-
Development of a new comprehensive catalog of electric systems components to be used in SimStadt as well as in Concordia’s Urban Simulation Platform.
In what follows, the new technology stack used to implement (4) is documented in detail. It uses four technologies to replace manual coding by code generation from models:
-
Ecore to model the catalog’s data and generate Java classes and persistence layer from it.
-
Eclipse Sirius for modeling and generating tables, forms and buttons to create, read, update, and delete data (CRUD).
-
E4, the Eclipse way of modeling the application user interface itself, e.g. the placement and behavior of views, editors, toolbars, menus, and more.
-
A template engine called Handlebars to generate fully parameterized simulation models from textual templates without programming.
The new technology stack is rooted in the Eclipse application framework and eco-system.[2] Its main advantage is the possibility to implement CRUD applications like parameter catalogs and their underlying data models with no or very view lines of handwritten code (low-code-development).
Plans are to use the same approach also for implementation of (3). Since task (2) and maybe (1) will use Eclipse, too, close integration of parameter catalogs and simulation environments seems feasible. E.g., a user could drag an electric system component from a catalog onto an INSEL block for parametrization.
The Eclipse application framework offers:
-
OSGI plug-in mechanism and UI framework for integrating applications and services
-
E4 application model to declaratively describe user interface’s structure
-
General notion of project with specific file types, help system, preferences etc.
-
IDE support for important general purpose languages like Java, Python, Ruby, C, Fortran, C++
-
Industry proven DSLs and code generators for data models and UIs based on the Eclipse Modeling Framework (EMF):
-
Ecore for model driven generation of Java classes and persistence layers for XML or data bases
-
Eclipse Sirius for describing and generating graphical and form based UIs
-
XText: Support for creating textual DSLs.
-
Mechanisms to adapt or extend data models and forms to specific needs (e.g., we added quantities — that is numbers with units — to Ecore, a feature very important for parameter catalogs)
-
-
Rich open source eco-system with lots of plugins and projects important for an urban simulation platform:
-
model server for distributed access and work on Ecore models, including model comparison and migration (CDO, EMFCompare)
-
GIS: storage, processing, and visualization of geographical data (list of projects under the umbrella LocationTech, e.g. user-friendly desktop internet GIS uDig)
-
traffic simulation (SUMO)
-
spatial multi-agent-simulation (GAMA-Platform)
-
scientific workflows (Triquetrum)
-
visualizations (Nebula)
-
machine learning (deeplearning4j)
-
45+ projects in the area of IoT
-
…
-
As always, all that glitters is not gold. When we go through the details below, some bugs and inconsistencies, typical for open source projects of this age and size, have to be addressed.
How to Implement Parameter Catalogs with Eclipse
At the end of this chapter, you should be able to build a running software prototype for creating and maintaining parameter catalogs based on a graphical data model of the domain you are an expert in.
To build data models and parameter catalogs from scratch, we first have to understand some basics about Eclipse, and then install the correct Eclipse package. Thereafter, we can model our data with Ecore considering some best practices, followed by the generation of Java classes and user interface (UI). Finally, we will install some plug-ins to "pimp" our Eclipse installation in order to add units and quantities to the mix.
Eclipse Basics
Eclipse was originally developed by IBM and became Open Source in 2001. It is best known for its Integrated Development Environments (Eclipse IDEs), not only for Java, but also for C++, Python and many other programming languages. These IDEs are created on top of the Eclipse Rich Client Platform (Eclipse RCP), an application framework and plug-in system based on Java and OSGi. Eclipse RCP is foundation of a plethora of general-purpose applications, too.
First time users of Eclipse better understand the following concepts.
An Eclipse package is an Eclipse distribution dedicated to a specific type of task.[3] A list of packages is available at eclipse.org. Beside others it contains Eclipse IDE for Java Developers, Eclipse IDE for Scientific Computing, and Eclipse Modeling Tools. Note that third parties offer many other packages, e.g. GAMA for multi-agent-simulation.
|
Several Eclipse packages can be installed side by side, even different releases of the same package. Multiple Eclipse installations can run at the same time, each on its own workspace (see below). |
An installed Eclipse package consists of a runtime core and a bunch of additional plug-ins. Technically, a plug-in is just a special kind of Java archive (JAR file) that uses and can be used by other plug-ins with regard to OSGi specifications. Groups of plug-ins that belong together are called a feature.
Sometimes, a user will add plug-ins or features to an Eclipse installation to add new capabilities.
E.g. writing this documentation within my Eclipse IDE is facilitated by the plug-in Asciidoctor Editor.
Plug-ins can easily be installed via main menu command Help → Eclipse Marketplace… or Help → Install New Software….
Some plug-ins may be self-made like our City Units plug-in that enables Ecore to deal with physical quantities.
Git is the industry standard for collaborative work on, and versioning of, source code and other textual data. Collaborative development of parameter catalogs benefits massively from using Git. Git support is built into Eclipse Modeling Tools, the Eclipse package we will use. However, if Eclipse needs to connect to a Git server that uses SSH protocol (not HTTPS with credentials), access configuration is more involved and may be dependent on your operating system.
Some users, anyway, prefer to use Git from the command line or with one of the client application listed here, e.g. TortoiseGit for Windows.
While it is required to get Git working at some point, we won’t refer to it in this document and, for now, do not cover the installation of Git on your machine or configuration of Git in Eclipse.
When you start a new Eclipse installation for the first time, you are asked to designate a new directory in your file system to store an Eclipse workspace.
Eclipse is always running with exact one workspace open.
As the name implies, a workspace stores everything needed in a given context of work, namely a set of related projects the user is working on as well as meta-data like preference settings, the current status of projects, to do lists, and more.
In case a user wants to work in different contexts, e.g. on different tasks, command File → Switch Workspace allows to create additional workspaces and to switch between them.
|
Any plug-in from the original Eclipse package or installed by the user later will be copied into the Eclipse installation directory, not in any workspace. Configuration and current state of plug-ins, on the other hand, are stored in workspaces. |
An Eclipse project is a technical term for a directory that often contains:
-
files of specific types for source code, scripts, XML files or other data
-
build settings, configurations
-
dependency definitions (remember the dependencies between plug-ins above?)
-
other Eclipse projects.
File → New → Project… offers many different types of projects that the user can choose from, e.g. Java projects to create Java programs, Ecore modeling projects, or general projects, that simple hold some arbitrary files.[4]
|
Files that do not belong to a project are invisible for Eclipse! |
The projects belonging to a workspace can either be directly stored within the workspace as sub-directories (the default offered to the user when creating a new project), or linked from it, that is the workspace just holds a link to the project directory that lives somewhere in the file system outside of the workspace. Linking allows to work with the same projects in different workspaces.
While it sometimes makes sense to share or exchange workspaces between users,[5], I do not recommend this for now.
Projects, in contrast, are shared between users most of the time, usually via Git.
In general, I would suggest to store Eclipse projects outside workspaces at dedicated locations in the user’s file system.
That way, we can follow the convention that local Git repositories should all be located under
<userhome>/git.
Setup Eclipse Modeling Tools
Starting with version 2022-03 Eclipse packages come with a bundled Java Development Kit (JDK), version 17. Thus, there is no need anymore to install a JDK manually.
Our graphical and form based modeling tools, e.g. Insel 9.0 and Parameter Catalogs, run on top of Eclipse Sirius, an open source framework that provides a set of features and plugins that can be added to any Eclipse package to transform it into a very flexible modeling workbench.
We will install Eclipse package Eclipse Modeling Tools first and, then, Eclipse Sirius on top. To get current version 4.23 (2022‑03) of Eclipse Modeling Tools, go to www.eclipse.org/downloads/packages/. On this page you may see "Try the Eclipse Installer" or similar. Do not follow this advice, since we want more control over what will be installed. Instead, look for package Eclipse Modeling Tools and click the download link for your operating system and system architecture displayed on the right:
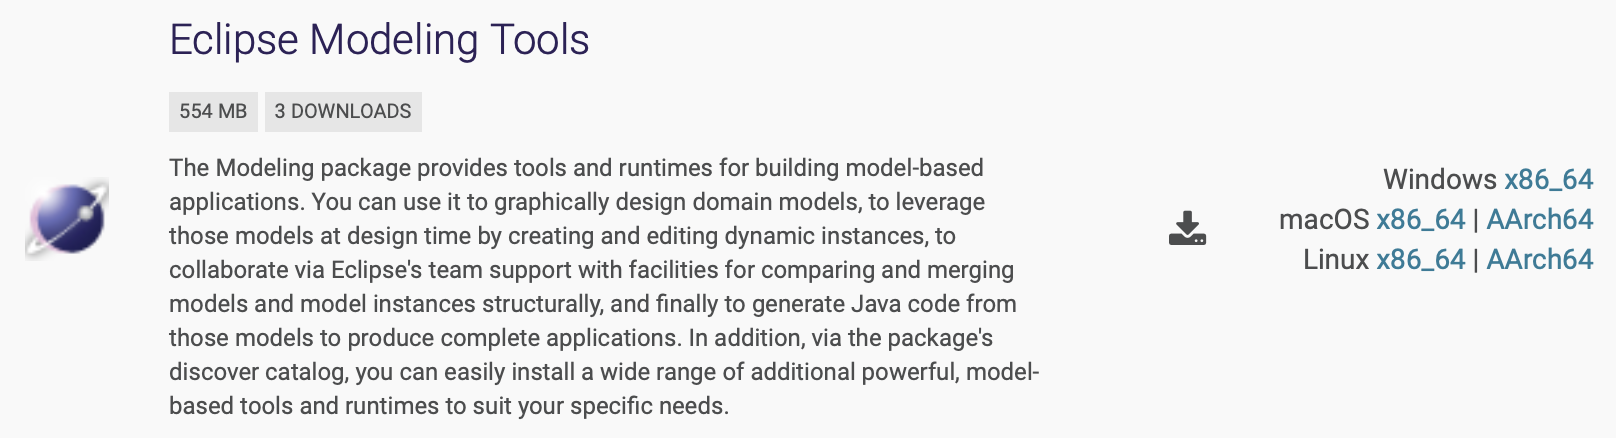
Finally, click on Download and wait for the 550 something MB package to arrive.
On macOS this is a disk image file (.dmg) that is mounted by a double click. Drag and drop Eclipse to folder Applications and rename the copy to something more specific like EclipseModeling2203.
On windows and Linux unzip/extract the downloaded file and possibly rename the resulting application to EclipseModeling2203 or similar. Then, move the application to a suited directory, but not Programs or Programs (x86) on Windows!
|
Special installation note for Windows: We found that sometimes plug-ins cannot be added to Eclipse, if it is installed in folder Programs or Programs (x86). Since we have to add plug-ins for Sirius and for handling units and quantities below, please make sure to unzip the installation package elsewhere, e.g. the Desktop or the user’s home directory. |
|
Depending on the operating system, several security dialogs have to be acknowledged during installation and first launch of Eclipse Modeling Tools. |
After installation has finished, launch the application for the first time and you will see a dialog for choosing a new empty directory as its workspace.
More workspaces might come into existence later, so replace the proposed generic directory path and name with a more specific one, e.g.EclipseWSCatalogs.
The main window appears with a Welcome Screen open.
Especially under Workbench Basics you will find exhaustive documentation on Eclipse that might be of interest later, e.g.:
-
Workbench User Guide
-
Concepts: perspectives, projects, views, editors, features, resources, …
-
Tasks: Working with perspectives, views and editors, installing new software. …
-
-
EGit Documentation
-
EGit User Guide
-
Git for Eclipse Users
-
-
Ecore Tools User Manual: Learn how to design Ecore models.
For now, you can dismiss the welcome screen. It can be opened anytime by executing Help → Welcome.
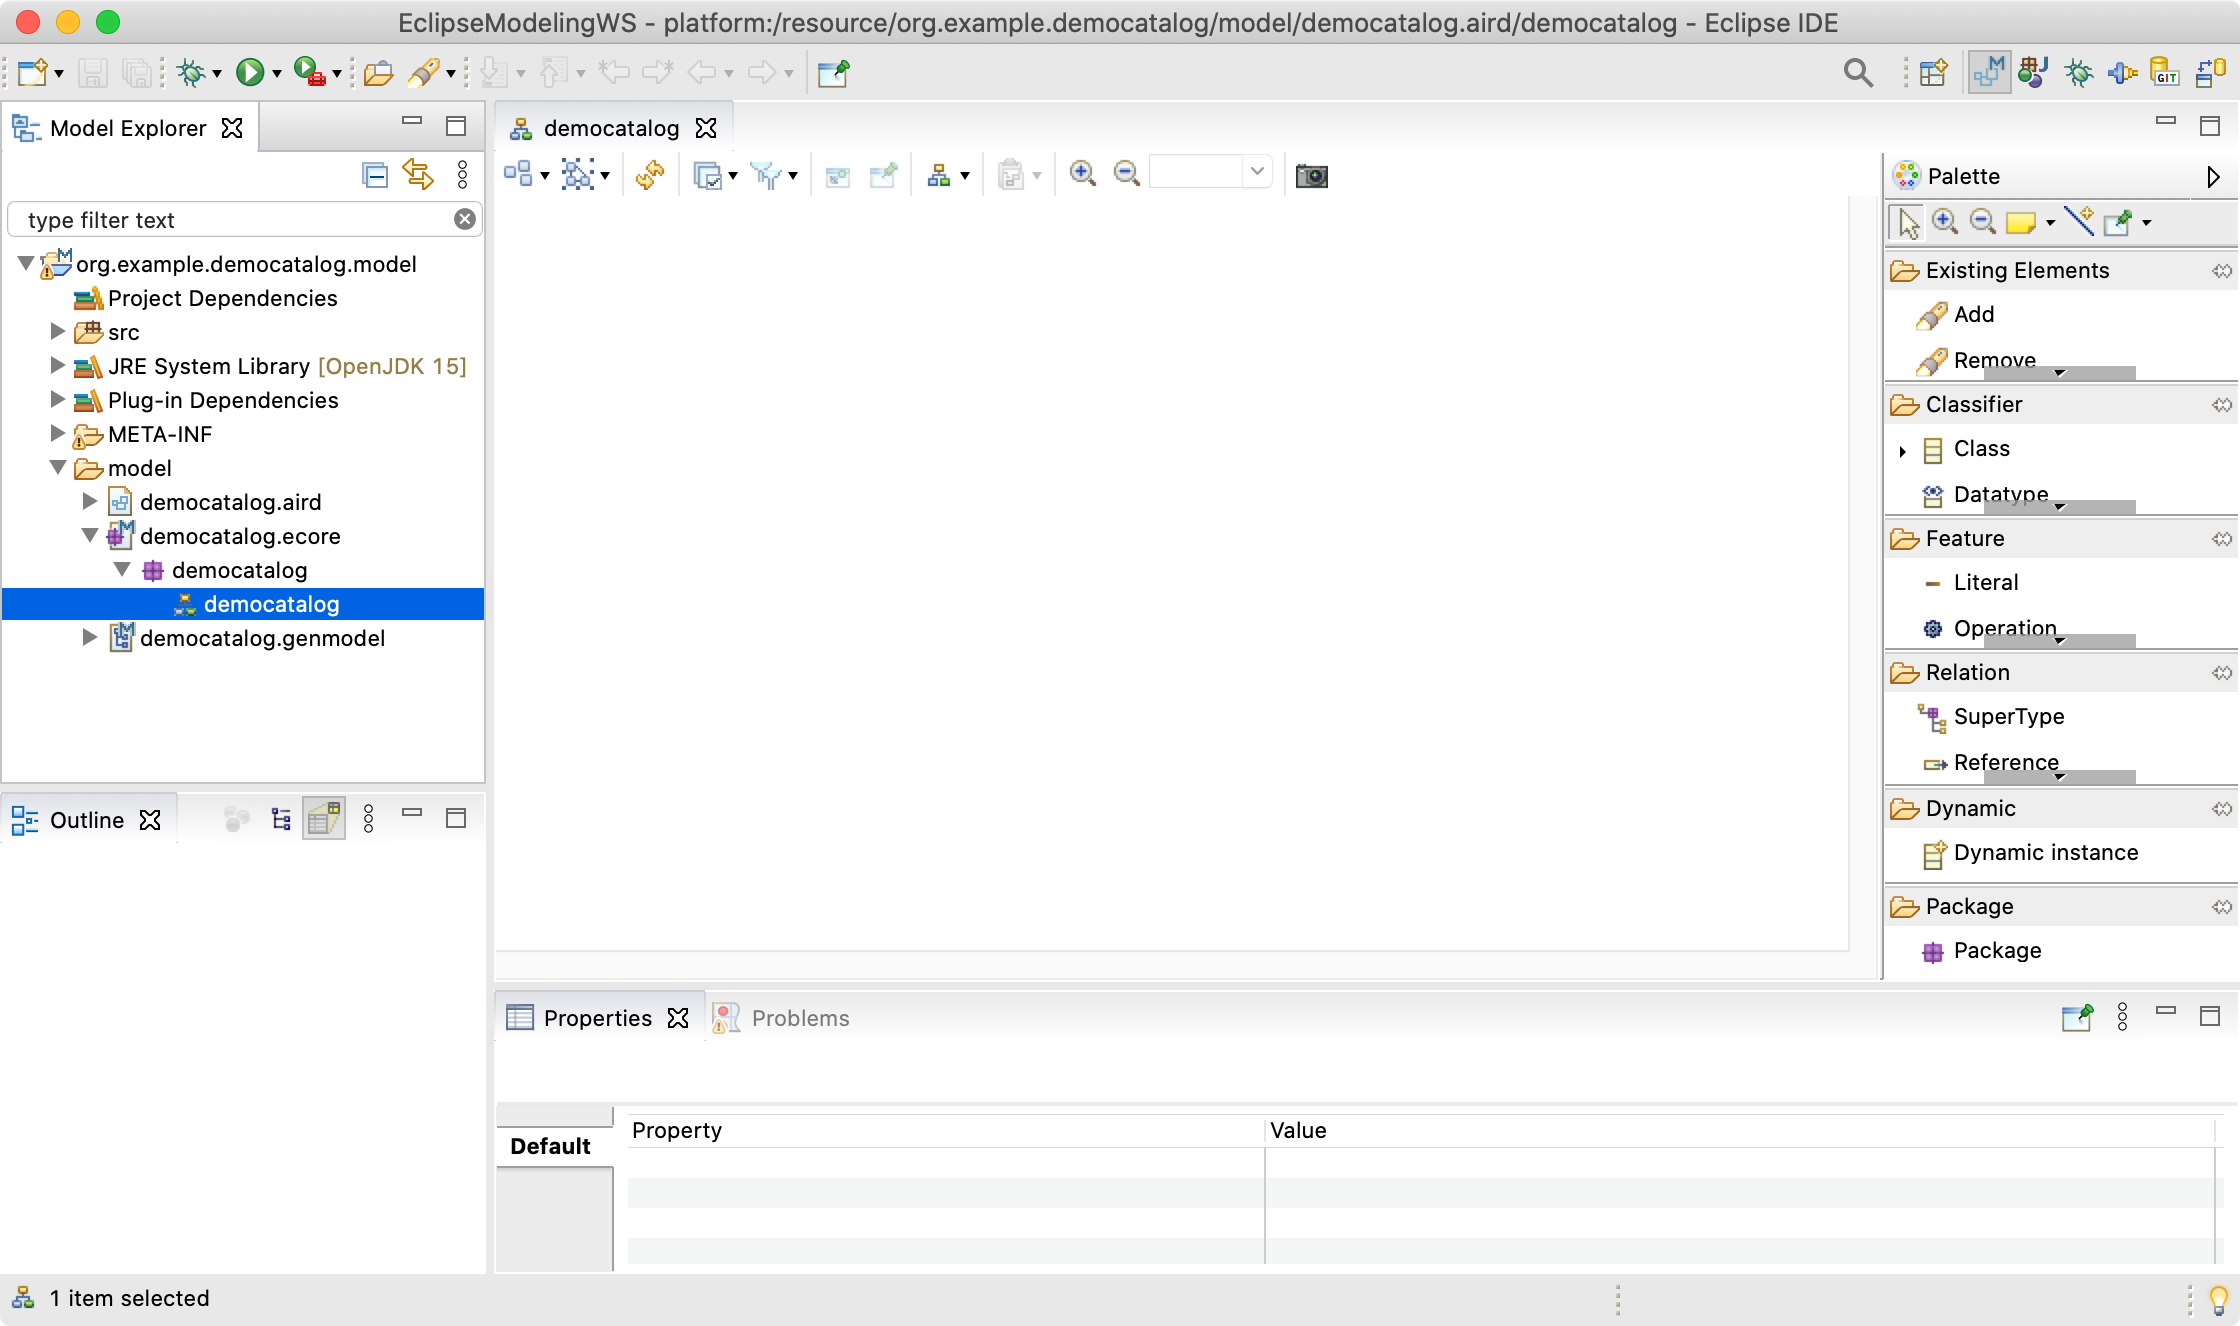
Now you should see the initial window layout with Model Explorer and Outline on the left and a big empty editing area to the right with a Properties view below.
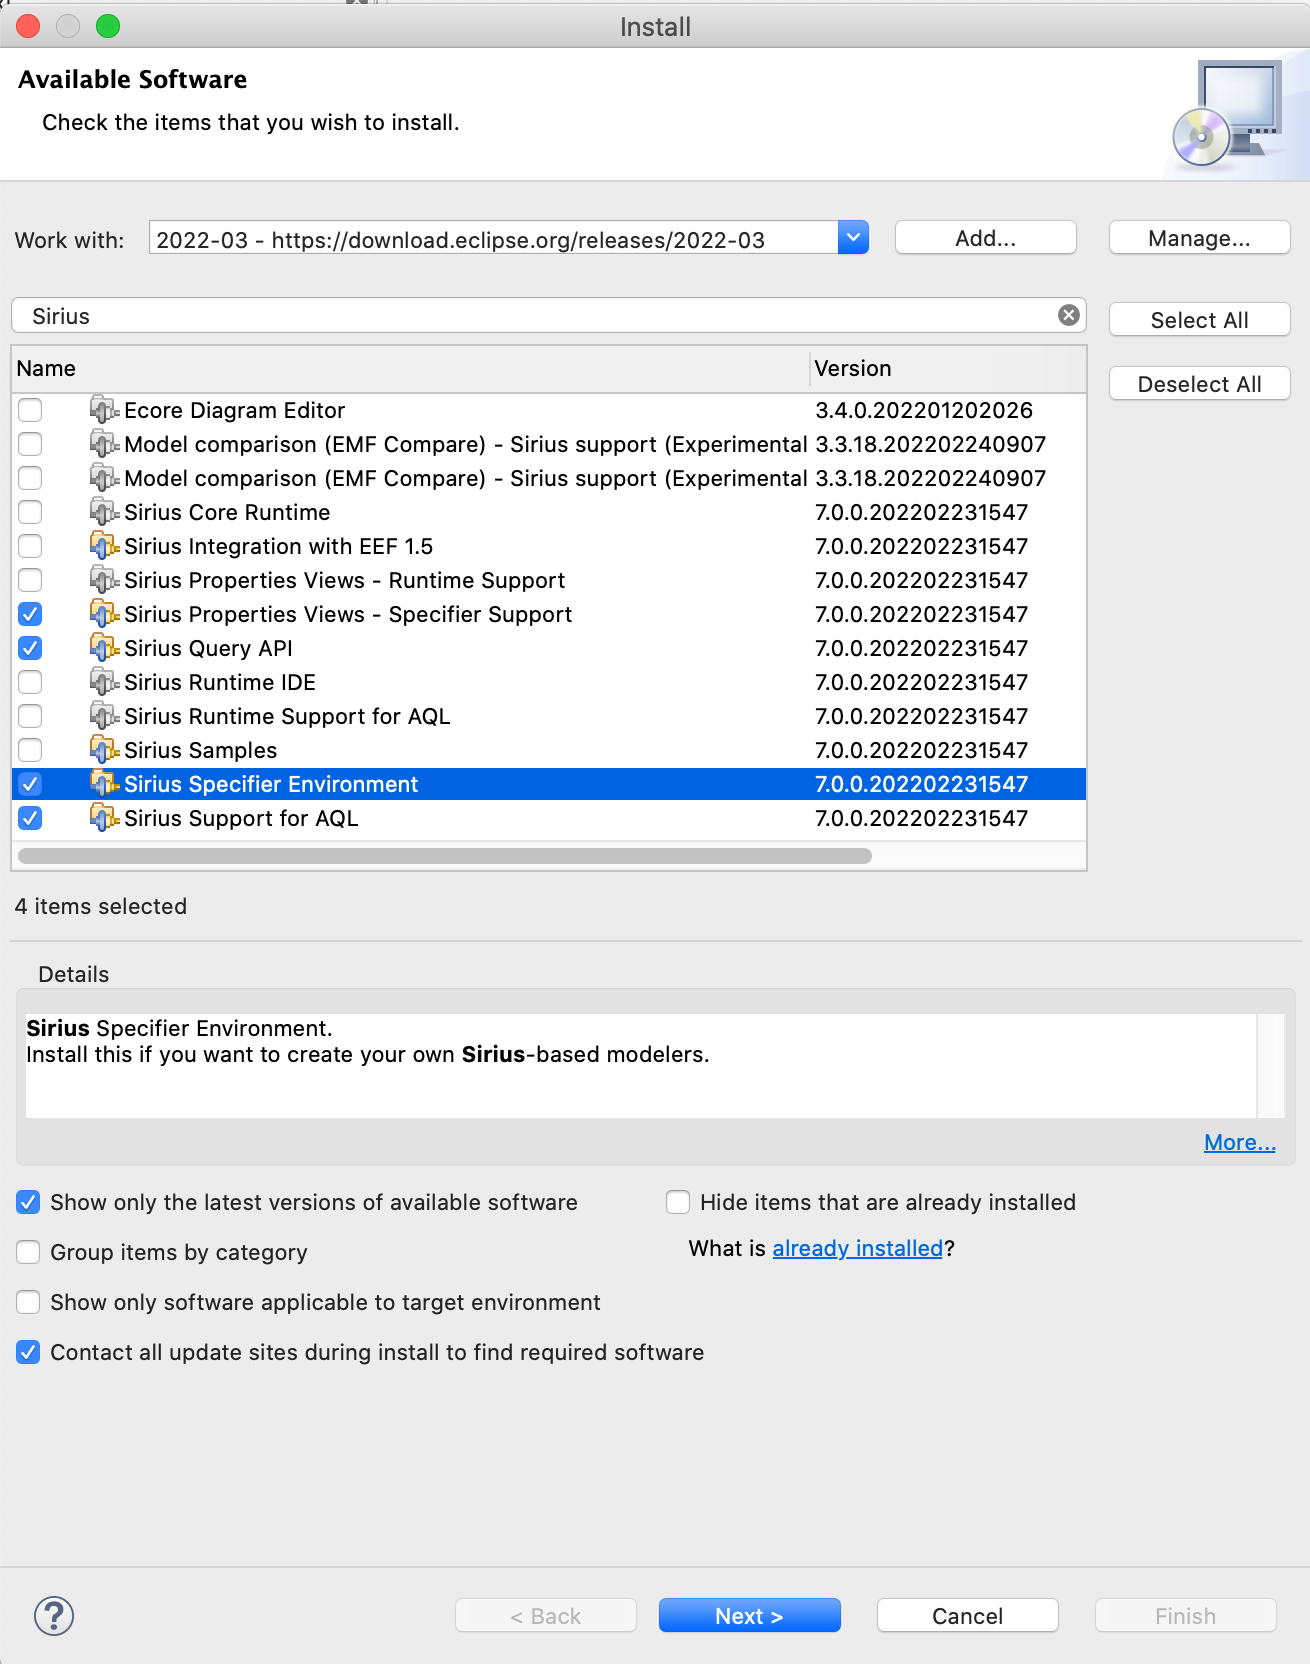
While package Eclipse Modeling Tools already contains Sirius features that let you create graphical Ecore models, features for specifying your own forms and graphical editors are still missing. You can add these features easily with Eclipse’s built-in update mechanism:
-
Open dialog
Help → Install New Software…(see screenshot below) -
For Work with: choose software site
2022-03 - https://download.eclipse.org/releases/2022-03/ -
Deselect Group items by category
-
Type Sirius into the search field
-
From the list of features select
-
Sirius Properties Views - Specifier Support -
Sirius Query API for AQL -
Sirius Specifier Environment -
Sirius Support for AQLand clickNext >
-
-
Acknowlege any licenses and restart Eclipse when asked for.
Now we use the same update mechanism to add software components that were created specifically for parameter catalogs and hosted at the transfer portal of HfT Stuttgart.
Parameter catalogs should be able to represent quantities, not just bare numbers. See Unit of measurement libraries, their popularity and suitability for a systematic account of open source solutions in the this area. Java provides an extensive framework to deal with quantities and their units defined in Java Specification Request (JSR) 385. The reference implementation for this framework is Indriya. Demos of its usage can be found at https://unitsofmeasurement.github.io/uom-demos/.
While Indriya offers all common SI units and more, the author provided additional units specific to urban simulation plus specialized Ecore types for specifying these units for attributes in Ecore data models as an Eclipse feature named City Units.
The new types are named Quantity and TimeOfDay. Some examples of valid unit symbols are listed in this README.
To install City Units, open dialog Help → Install New Software… and enter site https://transfer.hft-stuttgart.de/pages/neqmodplus/de.hft-stuttgart.cityunits/p2repo like depicted below.
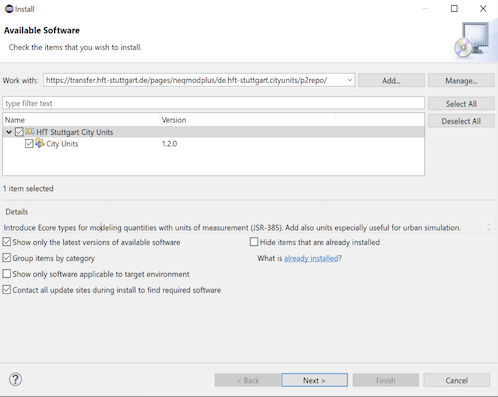
Select City Units, press Next > and acknowledge all following dialogs, including security warnings.
Finally, restart Eclipse to complete installation.
Exercise: Modeling a Parameter Catalog with Ecore
Before we start working on real catalog projects hosted in a Git repository in the next section, let us first create a demo project for playing around and learning basic modeling skills.
There are two hard problems in computer science: cache invalidation, naming things, and off-by-1 errors.
It takes time and effort to come along with good names for model entities, projects, files, and so on. Also, specific naming conventions are in place to enhance readability of models and program code. Since it is not always clear where names provided during modeling are used later, I compiled a list of names important in Ecore projects and added examples and comments to elucidate their meaning and naming conventions.
| Name | Demo Catalog Example | Real World Expample |
|---|---|---|
Namespace URI |
||
Namespace Prefix |
democat |
buildphys |
Base Package (reverse domain)[6] |
org.example |
de.hftstuttgart |
Main Package |
democatalog |
buildingphysics |
Eclipse Project[7] |
org.example.democatalog.model |
de.hftstuttgart.buildingphysics |
Class Prefix |
Democatalog |
Buildingphysics |
XML File Suffix |
democatalog |
buildingphysics |
Classes |
e.g. SolarPanel |
e.g. WindowType |
Attributes |
e.g. nominalPower |
e.g. id |
Associations |
e.g. solarPanels |
e.g. windowTypes |
Classes are written in Camel case notation starting with an upper case letter. Associations and attributes are written the same way, but starting with a lower case letter.
All other names should be derived from the globally unique name space of the project, in our example: example.org/democatalog.
It consists of a global unique domain name and a path to the project, unique within that domain.
Use the names of example Demo Catalog to create your first Ecore modeling project:
-
Execute
File → New → Ecore Modeling Projectfrom main menu — notModeling Project! -
Name the project
org.example.democatalog.modeland uncheck Use default location so that the new project is not stored in workspace but a different directory you create/choose, then clickNext > -
Provide
democatalogas main Java package name, uncheck Use default namespace parameter and providehttp://example.org/democatalogas Ns URI anddemocatas Ns prefix -
Click
Finish.
Eclipse should look like below with an new empty graphical Ecore diagram editor opened.
The diagram is automatically named democatalog after the package name for the Java classes that will be generated from it (provided above).
The Model Explorer shows the contents of the new Ecore modeling project.
To get your feet wet, do this:
-
Drag a Class from the palette on the right onto the editor’s canvas: it will materialize as a rectangle labeled
NewEClass1. -
The class symbol should be selected initially, so you can see its attributes in the Properties view.
-
In there replace
NewEClass1byEnergyComponentsCatalogto rename the class. -
Click anywhere on the canvas and notice that the class symbol is deselected and the toolbar at the top adapts accordingly.
-
In the toolbar change
100%to75%to scale diagram. -
Execute
File → Saveto save model and diagram on disk. -
Close diagram editor
democatalogby closing its tab. -
Reopen saved diagram by double click on entry
democatalogin Model Explorer.
Technically, everything is in place now to begin modeling the data that the projected catalog shall contain. Except … understanding the basics of object-oriented modeling would be helpful. This is why developers should support domain experts at this stage.
Ecore diagrams are simplified UML class diagrams. Here some resources on what this is all about:
|
Beginners are strongly encouraged to read the first two resources. The first one contains a gentle introduction, especially suited for domain experts. The second one can also serve as reference. |
We will touch central object-oriented concepts Class, Object, Attribute, Association, Composition, and Multiplicity in an example below, but work through above sources to get a deeper understanding and to enhance your modeling skills.
Note that above sources differentiate between conceptual and detailed models. We go for detailed models, since only these contain enough information to generate code. Having said this, it is usually a good idea to have two or three conceptual iterations at a white board to agree on the broad approach before going too much into detail. But even if one starts with Ecore models right away, these also can be adapted any time to follow a new train of thought.
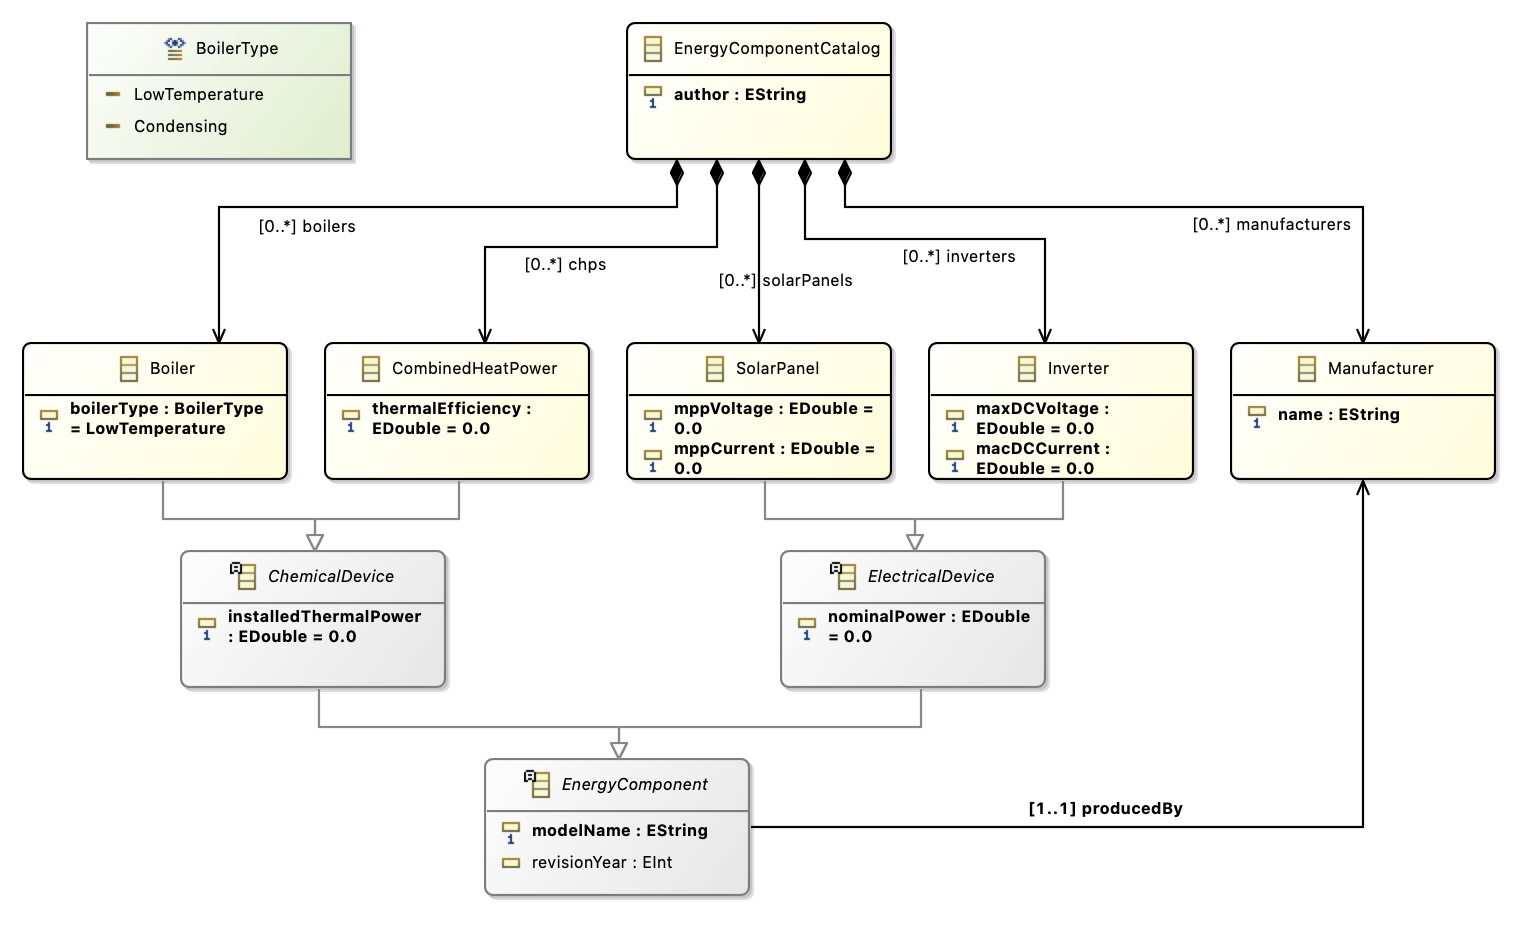
See here the essential and typical structure of a parameter catalog in a class diagram. Instead of artificial example classes like Foo and Bar it shows classes from an existing catalog, albeit in very condensed form.
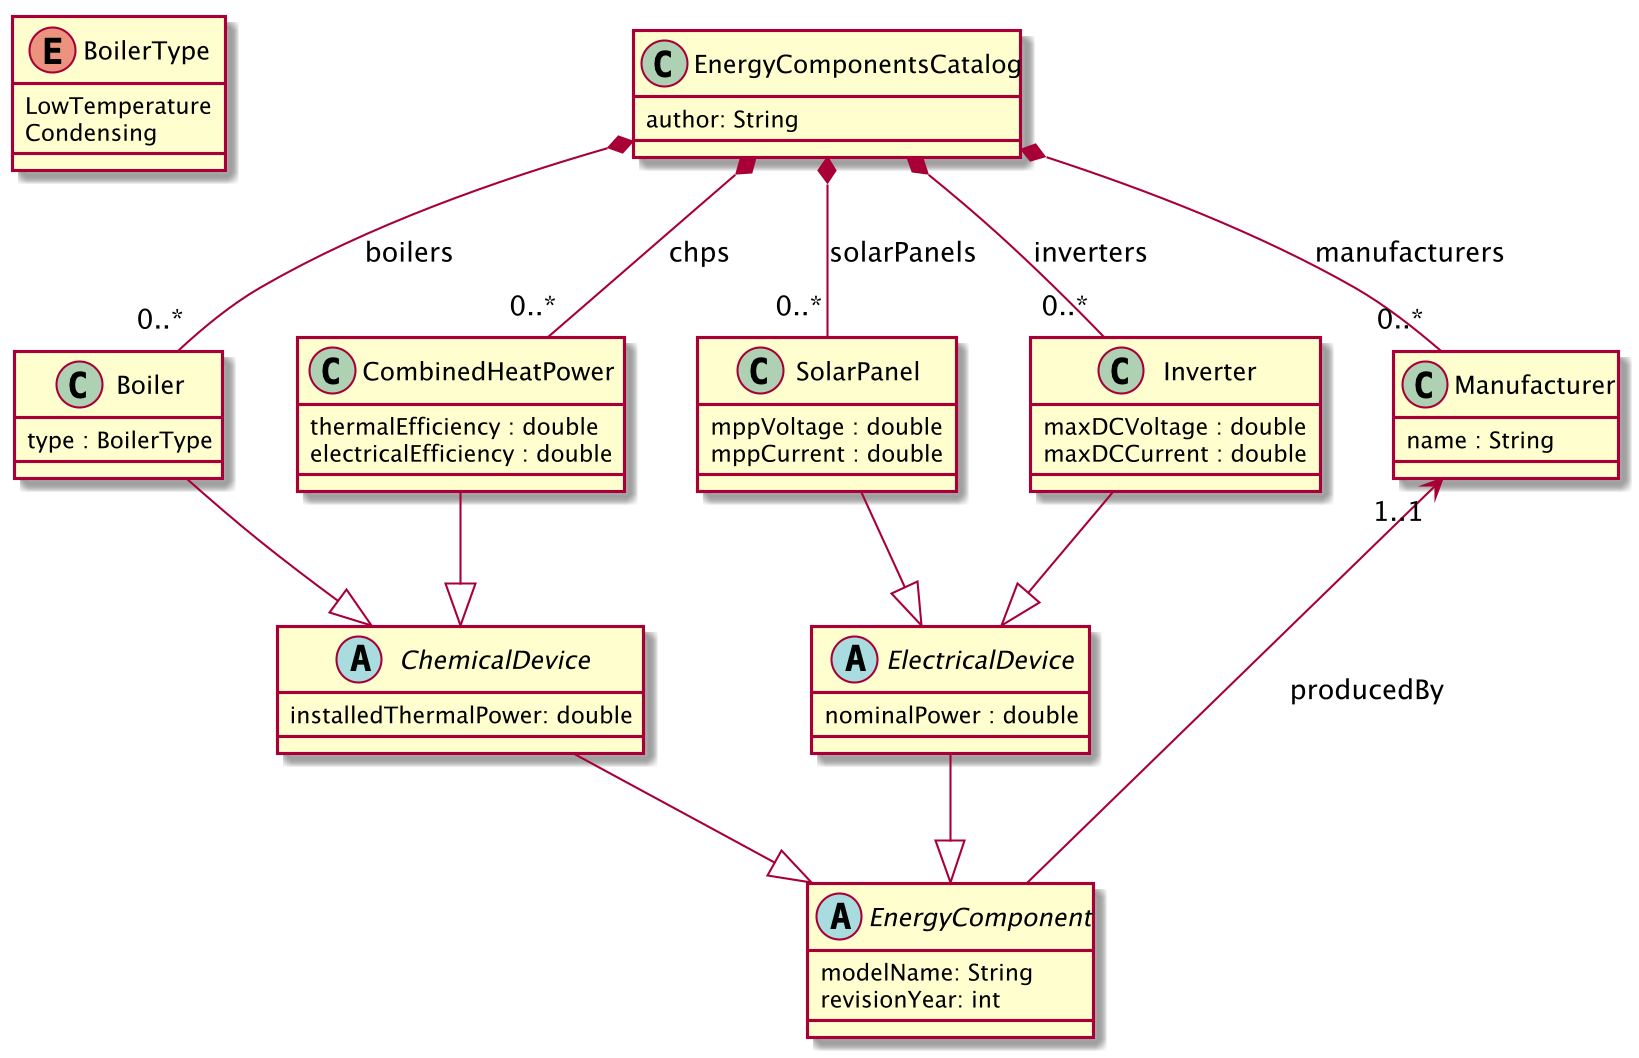
The diagram models four types of technical components whose data shall be stored in the catalog, e.g. for parameterization of simulation models later: Boiler, CombinedHeatPower, SolarPanel, and Inverter.
The catalog itself is represented by class EnergyComponentsCatalog. Unlike dozens, hundreds, or even thousands of objects to be cataloged — Boilers, Inverters etc. — there will be just exactly one catalog object in the data representing the catalog itself. Its "singularity" is not visible in the class diagram, but an Ecore convention requires that all objects must form a composition hierarchy with only one root object.
If, in the domain, one object is composed of others, this is expressed by a special kind of association called composition.
Compositions are depicted as a link with a diamond shape attached to the containing object. In the Boiler case said link translates to: The EnergyComponentsCatalog contains — or is composed of — zero or more (0..*) boiler objects stored in a list named boilers.
|
Note that class names — despite the fact that they model a set of similar objects — are always written in singular! Names for list-like associations and attributes usually are written in plural form. |
Besides composition of objects, the model above shows another, completely different, kind of hierarchy: the inheritance hierarchy between classes. Whenever classes of objects share the same attributes or associations, we don’t like to repeat ourselves by adding that attribute or relation to all classes again and again. Instead, we add a super class to define common attributes and associations and connect it to sub classes that will automatically inherit all the features of their super class.
In our example above, common to all four energy components are attributes modelName and revisionYear, thus these are modeled by class EnergyComponent that is directly or indirectly a super class of Boiler, CombinedHeatPower, SolarPanel, and Inverter.
Similar, Boiler and CombinedHeatPower share attribute installedThermalPower factored out by class ChemicalDevice.
SolarPanel and Inverter share attribute nominalPower modeled in abstract class ElectricalDevice.
You probably noticed a fifth type of objects contained in the catalog, namely Manufacturer objects stored in list manufactureres.
How come? Ok, here is the story:
Observe in our data model, reference producedBy points from EnergyComponent to Manufacturer making it uni-directional reference.
One can simply query the manufacturer of a product, but not the other way around.
With a bi-directional reference both queries would be available.
Observe also the annotations 0..* and 1..1 near class Manufacturer.
These are multiplicities of associations: An EnergyComponentsCatalog contains zero, one, or many objects of class Manufacturer and an EnergyComponent must reference exactly one manufacturer — not less, not more.
To recapitulate: Our example parameter catalog already exhibits all four types of relations provided by Ecore.
You find these in the Ecore editor’s palette shown here.
To create a relation between a sub class and a super class use tool SuperType.
Use the other tools to create an association between classes, may it be a simple (uni-directional) reference, a bi-directional reference, or a composition.
Obviously, attributes are central in data modeling.
Create one by dragging it from the palette onto our one and only class so far: EnergyComponentsCatalog.
The class symbol will turn red to indicate an error.
Hover with the mouse pointer over the new attribute and a tooltip with a more or less helpful error message will appear.
Current error is caused by that no data type was set for the new attribute.
Data types for attributes can be integer or floating point numbers, strings, dates, booleans, and more.
To get rid of the error:
-
If not already selected, select new attribute by clicking at it in the editor.
-
In view Properties find
ETypeand click button…to see a quite long list of available data types. -
Choose
EString [java.lang:String]from the list and the error is gone.
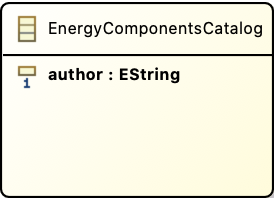
Change the attribute’s name to author and the class should look like shown here.
Most data types to choose from begin with letter E like in Ecore. These are just Ecore enabled variants of the respective Java types, thus, choose EInt for an int, EFloat for a 32 bit floating point number, EDouble for a 64 bit one, and so on.
Ecore allows to introduce new data types. We employ this feature later to enable data models with physical units and quantities.
There exists one other means to define the values an attribute can take, namely enumerations of distinct literals. Take Monday, Tuesday, Wednesday, … as a typical example for representing weekdays.
In our example data model you’ll find one Enumeration named BoilerType with values LowTemperature and Condensing.
The next section deals with generation of Java code from data models. To have more to play with, please implement our example model in Ecore now.
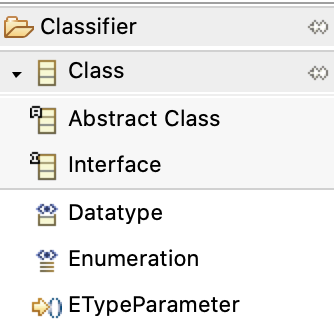
To do this, there is one more thing to know about classes: the difference between ordinary classes and abstract classes. 'Ordinary class' doesn’t sound nice, therefore, classes that are not abstract are called concrete classes. Our example diagram depicts abstract classes with letter A while concrete classes are labeled with C. You add abstract classes to a model with a special palette tool shown here.
The thing is: Objects can be created for concrete classes only!
In our example, it makes no sense to create an object from class EnergyComponent, because there is not such a thing like an energy component per se. Therefore, this class is abstract. It is true that an inverter is an energy component, thus inheriting all its features, but it was created as Inverter, not as EnergyComponent.
Super classes will be abstract most of the time.
So my advice is: Model a super class as abstract class unless you convince yourself that there exist real objects in the domain that belong to the super class but, at the same time, do not belong to any of its sub classes.
In the Ecore editor properties view, you can specify if a class is abstract or not, simply by toggling check box Abstract.
Two more tips and you are ready to rock and roll! — At least with your homework.
|
An exhaustive user manual for Ecore diagram editor is available at |
|
If Ecore models get bigger, you may find it more convenient to work with a form based UI instead of, or in addition to, the diagram editor.
Open this kind of editor via command |
That’s it for the data modeling part. By now, your Ecore model should look like this:
Making a Prototype Application to Create and Edit Data
In this section you will get a glimpse on how to create an application to create and edit data conforming to the Ecore data model of our demo parameters catalog.
Topics described here (and much more) are discussed in this Sirius Starter Tutorial.
If you are less interested in the details of UI creation, but more in working on already existing parameter catalog software and data, you may skip this section for now and proceed with [Working with Git Hosted Catalogs].
Let us bring the Ecore data model to life, that is, generate code from it that allows to create, read, update, and delete (CRUD) concrete data objects of modeled classes in computers:
-
Make sure all files are saved (
File → Save All) -
Execute
Generate → Allfrom the context menu of Ecore editordemocatalog
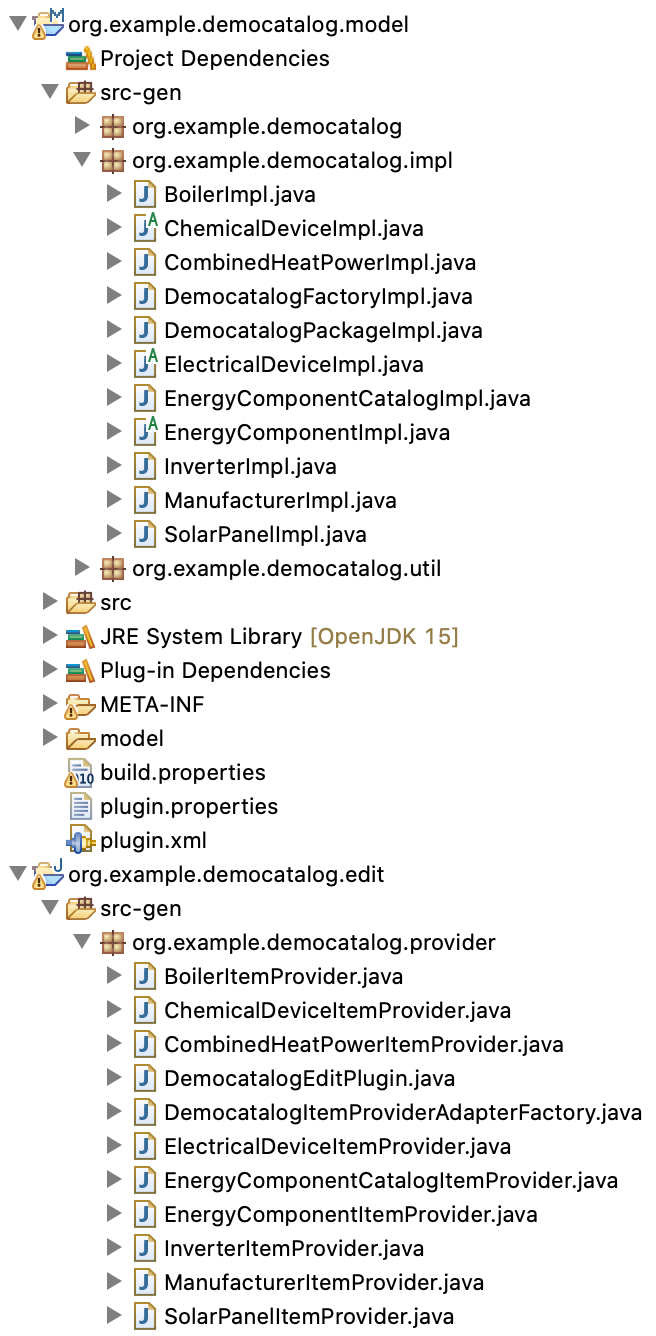
Generate → All creates classes that represent the modeled data in code at first. These classes are located in three packages under directory src-gen in org.example.democatalog.model. Then, the command generates Edit Code and Editor Code within two new Eclipse projects named org.example.democatalog.edit and org.example.democatalog.editor, again with generated classes in src-gen.
You may have a look at some Java classes for curiosity by double clicking at them in Model Explorer. There is no point in trying to understand the code in detail, but observe token @generated present in the comments of all classes, fields and methods. Classes, fields and methods marked with this token are (re)generated whenever above commands are executed.
Sometimes it is required to manually adapt generated code — after all our concern is "low code", not "no code" development. In that case, we will replace @generated by @generated NOT to prevent code regeneration of the respective item.
After code generation, you may have noticed some warnings showed up in view Problems.
In general, it is highly recommended to resolve warnings, and errors of course, but we will make an exception from the rule, since the warnings are uncritical and would reappear each time code is regenerated.
Firstly, launch a new instance of the running Eclipse application:
-
Execute
Run → Run Configurations…from the main menu and double click on Eclipse Application to get a New_configuration. You may want to rename New_configuration to DemoCatalog or the like. -
Press
Runto start the new Eclipse application that is basically a copy of your running Eclipse but with a different workspace. -
In the new application window close the welcome screen and open the Sirius perspective using the suited button in the top right corner of the main window. This perspective provides specific Sirius menus and new project types.
Secondly, create a project that will contain catalog data (remember Eclipse can only handle files that are part of a project):
-
From main menu execute
File → New → Modeling Project— notEcore Modeling Project! -
Name the project
org.example.democatalog.dataand uncheck Use default location so that the new project — again — is not stored in workspace but a different directory you create/choose, usually a directory named like the project and sitting side by side to the model, edit and editor project directories created above. -
Click
Finish.
Thirdly, create a first XML file for catalog data:
-
From main menu execute
File → New → Other…and typedemointo search field Wizards: -
Select
Example EMF Model Creation Wizards → DemoCatalog Modeland clickNext > -
Select
org.example.democatalog.dataas parent directory and name the data fileFirst.democatalog -
Click
Next >and chooseEnergy Component Catalogas the root data object that will be created initially -
Click
Finish.
A new entry named First.democatalog should appear in the Model Explorer.
Double-click it and a generic editor will open.
In principle, one could use this editor to add new data to the catalog via New Child > in the context menu over entry Energy Component Catalog.
Data of a selected entry can be edited in view Properties that is generic, too.
When done, you may save First.democatalog so that after closing the application data will reappear if it is opened again as described above.
The generic editors don’t get as far. Usually, one would like to have tables, custom property sheets, input validation, and more. Well, Sirius is all about creating nice graphical and form-based editors for data models specified in Ecore. To do this we need one more Eclipse project.
Like the data of our catalog is modeled as an Ecore file using a dedicated graphical editor, so will the user interface (tables, trees, diagrams, property views) be modeled in a Sirius .odesign file that lives in a special Eclipse project that we create while still in the (second) Eclipse application that hosts the data:
-
Execute
File → New → ViewPoint Specification Project -
Name the project
org.example.democatalog.design, uncheck Use default location as always and create/choose a directory with the same name as the project besides to the model, edit, editor, and data project directories -
Click
Finish.
A special editor for file democatalog.odesign appears automatically.
In it select MyViewpoint and rename it in Properties to Catalog.
A viewpoint provides a set of representations (tables, trees, diagrams, property views) that end-users can instantiate.
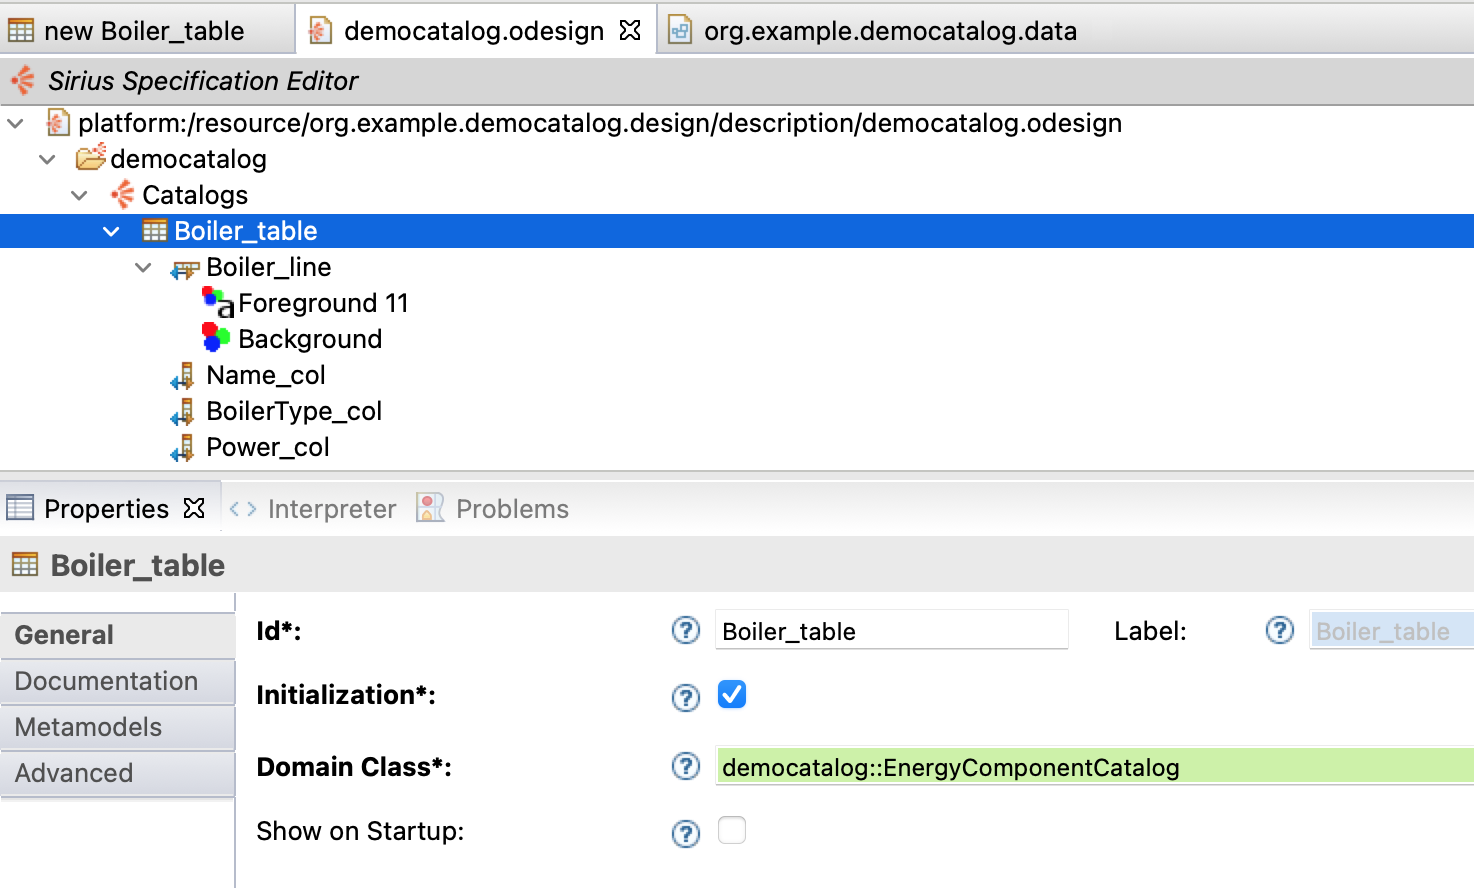
In what follows, we work with the democatalog.odesign editor. Say, we want to add a table for boilers to the UI:
-
From context menu over viewpoint Catalogs execute
New Representation → Edition Table Descriptionto create a new description that is automatically selected and shown in view Properties -
To connect the table with its data model, choose tab Metamodels in Properties, click on Add from registry and select
http://example.org/democatalog. -
Go back to tab General and enter
Boiler_tableas Id. -
In the green input field Domain Class press key ctrl-space and choose
democatalog::EnergyComponentCatalogfrom the list.
From the above Boiler_tables know that they present data conforming to our http://example.org/democatalog data model and that boiler data are found as part — or "below" — the Energy Component Catalog.
Next, specify the lines to be displayed in the table:
-
From context menu over Boiler_table create
New Table Element → Line -
In tab General in Properties, enter
Boiler_lineas Id: -
In the green input field Domain Class press key ctrl-space and choose
democatalog::Boilerfrom the list.
And now for the columns:
-
From context menu over Boiler_table create
New Table Element → Feature Column -
In tab General in Properties, enter
Name_colas Id: -
In the green input field Feature Name press key ctrl-space and choose
modelNamefrom the list -
Repeat the above steps for
boilerTypeandinstalledThermalPoweraccordingly.
After addition of some foreground and background styles, the design of the UI looks like this.
Save it!
To create an instance of the table just designed double-click on representations.aird in the data project:
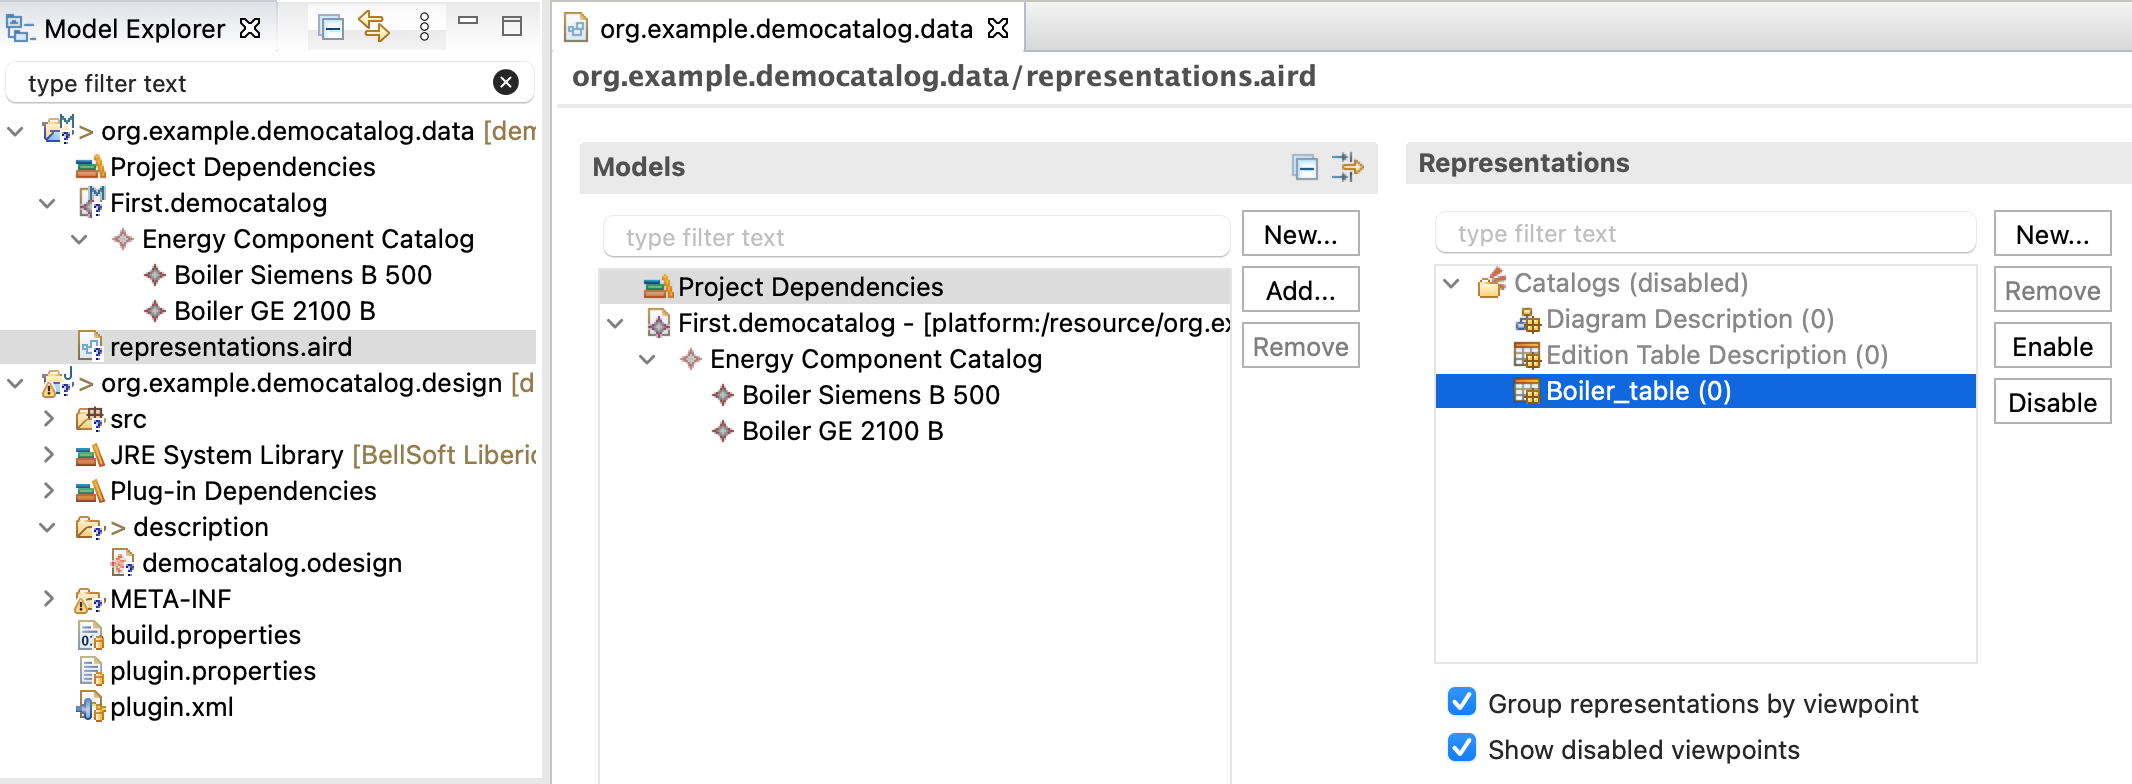
In case viewpoint Catalogs under header Representations is still disabled as shown above, select it and press Enable. Then:
-
Press
New…to open a Create Representation Wizard -
Choose
Boiler_tableand clickNext > -
Select
Energy Components Catalogas data source and clickFinish -
You are prompted for the new tables name: simply confirm the proposed name with
OK.
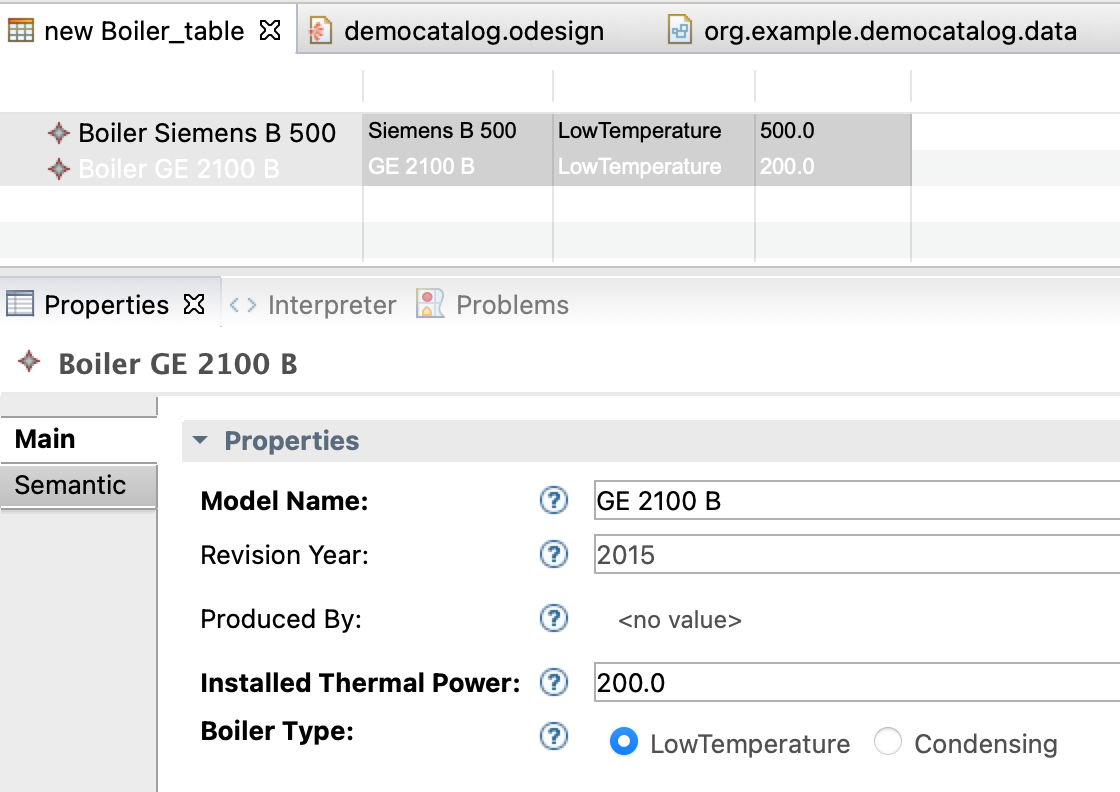
The screenshot on the right shows new Boiler_table with just two entries. Details of the selected entry are editable in Properties.
Is your table empty? In this case you probably did not add example data using the default editor as described above.
But you can add new Boilers any time via command New child → Boiler in the context menu of Energy Component Catalog in section Models of the representations editor depicted above.
Note, that you can delete boilers from the table’s context menu, but currently there is no button or menu entry to create new boilers.
Such a command would have to be described in democatalog.odesign first.
Be aware that applications with UI design and example data launched from development environment are meant to be prototypes for the final software only. In fact, any saved changes in the design file are instantly reflected in the UI. During refinement of model and UI, data sets can be created, edited, and tested for usability without the need to built deployable software component. (On deployment, see parts Accessing and Using Parameter Catalogs and Build (Parameter Catalog) Applications with Eclipse Tycho below.)
Iteratively the UI design must be adapted to changes in data model, although some changes are automatically reflected in the generated UI, at least for default forms. Data model changes can also can render existing XML data incompatible. There are tools for data migration, but for now, recreation of test data or manual editing of XML file is the way to go.
As you may imagine, this is just the tip of the iceberg of what can be done with the Sirius framework for designing graphical UIs.
While domain experts should be capable to create and to refine Ecore data models, the UI design of a parameter catalogs will mainly be done by software developers.
However, since the UI is not implemented by program code, but a description in an .odesign file, domain experts can easily enhance and tweak it, e.g. by adding or reordering columns of a table.
Working with Git Hosted Parameter Catalogs
Ecore data models and Sirius based UI design are used to create parameter catalog software hosted in Git repositories. To work with these, all you need is Java, Eclipse with required plug-ins for Sirius and Unit handling (see Setup Eclipse Modeling Tools for details.)
To connect to a Git repository open the Import Projects from Git wizard via File → Import… → Git → Projects from Git → Clone URI. Then:
-
Copy the URI of the git repository into the according input field, e.g.: https://rs-loy-gitlab.concordia.ca/parameter-catalogs-ecore/greenery-catalog.git and provide your credentials in fields User and Password. Tick check box Store in Secure Store and provide a master password if required! If you don’t, be prepared to be prompted for your credentials over and over again
-
Click
Next >and select a repository branch to check out, usually main or master -
Click
Next >and choose the directory on your file system where to store the repository, e.g.<user home>/git/greenery-catalog. Here, we adhere to the convention is to have all git repositories stored in<user home>/git/ -
After data transfer has completed, the wizard offers to Import existing Eclipse projects. Click
Next >and select the project with suffix.design,.model,.editand.editorfor import, e.g.ca.concordia.usp.greenerycatalog.modeletc. -
Click
Finish.
Now you can work on the data model like you did with the demo catalog. Find it under model in ca.concordia.usp.greenerycatalog.model (compare fig. New Ecore Modeling Project).
For data inspection and editing — and possibly modifying the UI — launch a new instance of the running Obeo Designer application by executing Run → Run Configurations…, double-click on Eclipse Application to get a New_configuration and give it a meaningful name (e.g. GreeneryCatalog).
Then, press Run to start the application, close the welcome screen and open the Sirius perspective using the suited button in the top right corner of the main window.
|
Simply reuse the Run Configuration specified above, when starting the application next time! |
Now, import the projects that contain data and UI design, respectively:
-
Execute
File → Import…for the import wizard -
Browse to the directory containing the projects (e.g.
<user home>/git/greenery-catalog) and check just the project with suffix.datafor import, e.g.ca.concordia.usp.greenerycatalog.data -
Click
Finish.
When closing the application, it asks to store or dismiss any changes in data or UI design. You can also save these any time with File → Save All.
For simplicity, the demo catalog only used built-in attribute types like EDouble, EInt, or EString.
On the other hand, real-world parameter catalogs use a custom type named Quantity that combines a numerical (double) value with a unit.
Symbols for defining units follow SI and other standards, including decimal prefixes like m for Milli or G for Giga as well as derived units, that is: mV, GV or kW·h/m³ are all valid unit definitions.
This is all documented well in the resources mentioned in section Add Plug-ins to deal with Quantities and Units above, but for convenience, a table with valid units, including some specific units for urban simulation, is compiled in UnitsExamples.md.
To set an attribute’s type to Quantity just select it in the model, choose tab Semantic in view Properties, click on EType and select Quantity from the list of available types. In the figure below, this was already done.
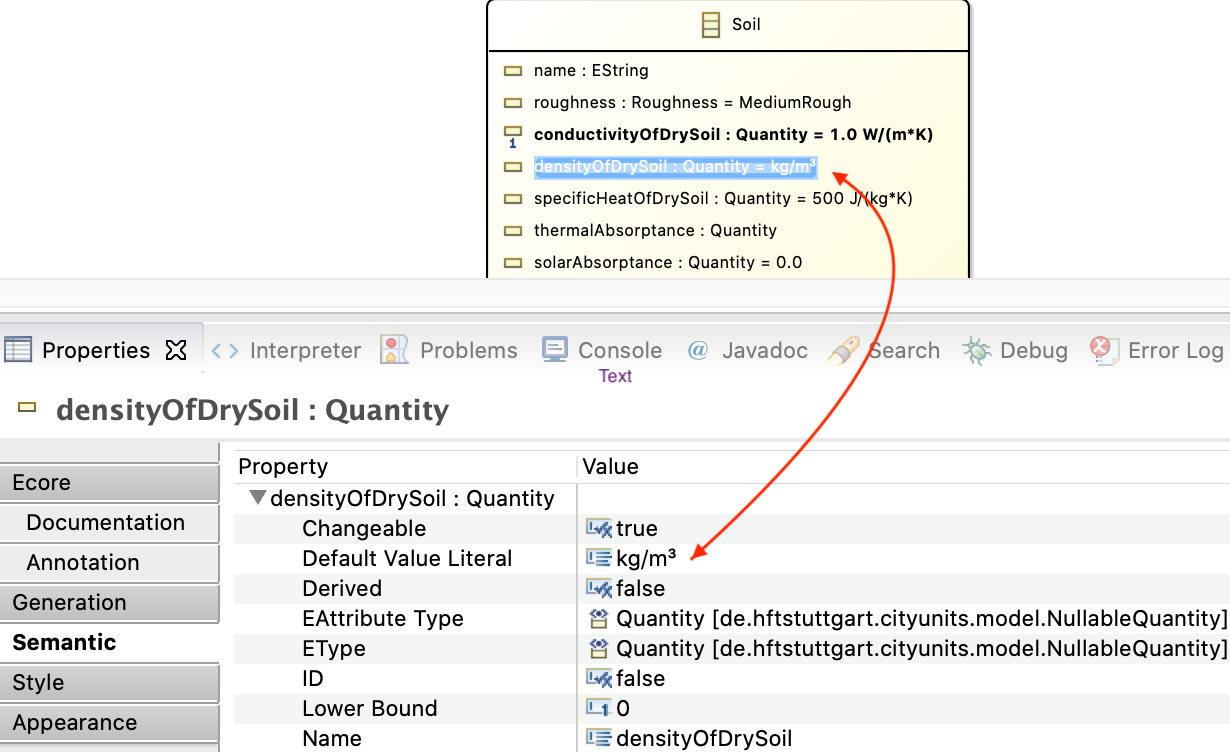
The red arrow shows how a unit is defined in field Default Value Literal. E.g., attribute densityOfDrySoil has unit kg/m³ assigned to it.
Note that, for this attribute, no numerical default value is given.
In contrast, conductivityOfDrySoil is given a unit and a default numerical value: 1.0 W/(m*K).
|
The unit of a Quantity is definied by the sub-string that follows the first space character in the string given in Default Value Literal. The sub-string before that space is interpreted as default numerical value of the Quantity. |
The rules for how a Quantity default value is converted to its unit and default (initial) numerical value are very "forgiving":
-
If no unit is given or it cannot be parsed to a valid unit, it will be regarded as dimensionless. E.g., index values, fractions and percentages are dimensionless quantities by purpose. While units may be displayed in the UI like
[kg], a dimensionless quantity will show up as[], that is as the empty string. -
If no numerical default value is present, then the numerical value is regarded as undefined.
-
You may choose to specify a quantity as dimensionless and without numeric default by leaving field Default Value Literal empty (or provide some non-sensical string).
By this rules, any string — including the empty string — will be interpreted as a Quantity somehow.
What is the point in declaring a dimensionless quantity for an attribute, anyway, instead of just declare it EDouble or EInt? The answer is that quantities can — and most of the time will — have a range of valid values defined.
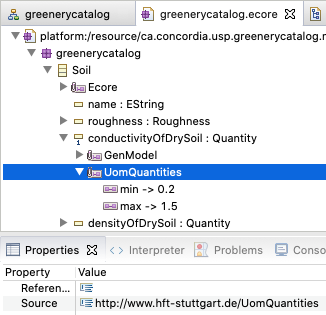
As you can see in the screenshot, the allowed range of attribute values is defined by a so called Ecore annotation named UomQuantities.
It provides the minimal and/or maximal value for the attribute, inclusively.
If a minimal or maximal value is omitted or invalid, the range is not limited on that side.
One could add annotations to an attribute in the graphical Ecore editor under tab Annotation in Properties, but it may be more convenient to do this in the standard editor that is opened by Open With → Sample Ecore Model Editor from the context menu over the Ecore model file in Model Explorer.
In this editor, define a range like this:
-
From the context menu of the attribute of interest execute
New Child → EAnnotationand typehttp://www.hft-stuttgart.de/UomQuantitiesinto fieldSourceas depicted above -
From the context menu of the new
UomQuantitiesannotation executeNew Child → Details Entryand provide values for keysminandmax, respectively.
|
The above typing is a one time effort only, since for defining further ranges, one simply copies an existing |
If a catalog’s end user tries to enter a number outside the given range in the UI, it will be adapted automatically to a valid value.
Again, domain experts use a specific annotation to provide short help texts that inform end-users about an attribute’s purpose, range and so on.
(These texts are displayed as tooltips when the users mouse stays on top of a question mark.)
And again, this is possible only in another kind of editor — this time the editor that is opened on a .genmodel in Model Explorer.
Each Ecore model is accompanied by a .genmodel that lives besides the respective .ecore file. Open the required editor from its context menu with Open With → EMF Generator.
The picture below shows the details. Just open the .genmodel tree until you can select the attribute that shall be documented.
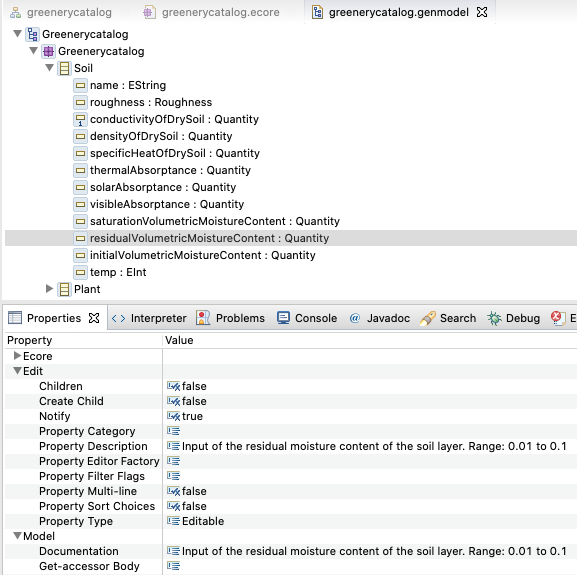
In its Properties provide the tooltip in field Edit → Property Description.
In this example, the same text was also copied to Model → Documentation.
These texts are automatically inserted into comments in the generated program code, so that they
can inform a programmer that wants to use the generated API.
Summary
Congratulations on making it this far. What have we achieved?
We get to know Eclipse Modeling Tools and created a graphical Ecore data model with one catalog class and five classes/types of domain objects therein. Classes have been defined by name, attributes, and relationships between them, often with cardinalities. Whenever classes shared some attributes or relationships we factored these out into super classes. An enumeration introduced a new attribute type as a set of named values.
From this data model, we issued commands to create Java code for representing the data in memory as well as to store and retrieve them on and from disk. Methods to create, read, update and delete data objects (CRUD) were generated, too.
We implemented a prototypical user interface for this data with Eclipse Sirius by providing a .odesign model for that very UI.
Lastly, we started working on real world parameter catalogs hosted in git repositories and introduced Quantity as a custom attribute type to model quantities as numerical values with defined units.
TBD: Accessing and Using Parameter Catalogs
Some terminology first:
-
The Urban Simulation Platform at CERC shall support scientists, urban planners and stake holders in performing Urban Simulation Projects
-
An Urban Simulation Project aims at evaluating one or several Urban Scenarios with respect to climate, environmental, economic and social performance.
-
An Urban Scenario describes a real or envisioned Urban Infrastructure in combination with a Scenario Description, that systematically assigns Archetypes to the elements of an Urban Infrastructure so that different policy measures, technological, environmental, social, or economic conditions can be modeled and simulated.
-
Urban Infrastructure is a model of the build environment at a specific year and geographic location, embedded in a given landscape, natural and urban environment.
-
Urban Development Scenario would be a series of Urban Scenarios over several years that could be created manually or rule-based.
-
Abstractly, an Archetype is an identifiable set of parameters for some component or system of components that should be easily/automatically be assignable to elements of an Urban Infrastructure. See the examples in the table below.
| Archetypes for | Defined by | Identifiable and Assignable by |
|---|---|---|
buildings |
archetypes for windows, walls, roofs, energy systems |
function, renovation state, age, geometry/size, world region/climate |
walls, roofs |
materials and sequence of material layers of certain thickness |
|
windows |
glazing number, U-value, … |
|
occupation |
common patterns or schedules of usage of Urban Infrastructure elements, e.g. buildings or roads |
|
-
Building archetype, assignable via building function, renovation state, age, geometry/size, world region/climate: a collection of archetypes for windows, walls, roofs, energy systems
-
Wall/Roof archetype, assignable via building archetype:
-
Vegetation archetype, assignable via world region/climate, underground, roof/wall geometry, landscape: specific sequence of soil layers with a certain mixture of plants
-
Meteorology: Climate parameters and weather data (assignable via geographic location)
-
Energy System archetype: ?
-
Occupation archetype: Common patterns or schedules of occupation and usage of elements of the _Urban_Infrastructure, e.g. buildings or roads
-
Water tube archetype: ?
Parameter catalogs provide manual and programmatic access to parameters describing general or often used components or systems of components that describe parts of an urban model (aka infrastructure data). These components or systems of components are called archetypes.
Using Ecore Catalog Data with Python
To access catalog data via Python, we use PyEcore, a Python re-implementation of Ecore (see PyEcore Documentation)
While it is possible to work with an Ecore data model and according data in a purely dynamical fashion by accessing data just by name using reflection, here we prefer a "statical" approach, that generates explicit Python classes from the Ecore data model in a first step according to this part of the above documentation.
After installation of the required Python libraries pyecore and pyecoregen (see documentation above), this command generates Python classes from an Ecore data model:
pyecoregen -e EnergyComponentsForPython.ecore -o .
Here we assume an Ecore data model EnergyComponentsForPython.ecore to be located in the current directory and the output be generated in a new directory located besides the model file.
See contents of python in project /de.hftstuttgart.energycomponents.model as an example.
Note that EnergyComponentsForPython.ecore is different from the original EnergyComponents.ecore in that attribute type Quantity was replaced by String for now, since a suited Python library to represent Units and Quantites has not been choosen yet.
With Python Ecore libraries and generated classes in place, according catalog data can be imported and queried like so:
from pyecore.resources import ResourceSet, URI
from energycomponents import EnergyComponentsCatalog
rset = ResourceSet()
resource = rset.get_resource(URI('EnergyComponentsForPython.ecore'))
datamodel_root = resource.contents[0]
rset.metamodel_registry[datamodel_root.nsURI] = datamodel_root
# At this point, the .ecore data model is loaded in 'rset'
resource = rset.get_resource(URI('HfTStuttgart.energycomponents'))
catalog: EnergyComponentsCatalog = resource.contents[0]
# Navigate data with lambdas, attributes and references
for res in filter(lambda chp: float(chp.electricalEfficiency) < 0.32, catalog.combinedHeatPowerUtilities):
    print("Efficiency of CHP", sel.modelName, "by",
          res.manufacturer.name, ":", res.electricalEfficiency)
With HfTStuttgart.energycomponents as input, we get:
Efficiency of CHP GB4-8 by GIESE Energie- und Regeltechnik GmbH : 0.26
Efficiency of CHP Mephisto G16+ by kraftwerk Kraft-Wärme-Kopplung GmbH : 0.315
Efficiency of CHP M-AT 12 by Motoren AT GmbH : 0.279
TBD: Distribution of Parameter Catalogs
Three plugins so for for the content and UI.
Missing: Deployable application and inclusion to third party libraries.
Building an application "around" the three plugins for Ecore data model and UI specification model.
Use Maven and Tycho as Build System
We are going to create a complete Eclipse desktop application from generated code. We also want to deploy this application for Linux, macOS and Windows operating systems. Eclipse offers several approaches for compiling and deploying such an application, traditionally with Ant scripts.
Creation and maintenance of these scripts turned out to be tedious and error prone. For quite some years now, the proposed — and mostly supported — method for building Eclipse applications is to use Maven build system, more specifically, a couple of Maven plug-ins, subsumed under the name Tycho.
Many Eclipse platforms have Maven support M2Eclipse already built in, not so our Eclipse Modeling Tools. But don’t worry: Installation of required Eclipse feature is easy and straight forward. And, by the way, you will acquire the indispensable skill of how to install new plug-ins/features to Eclipse.
First, tell your Eclipse installation where to look for the new software.
Execute Help → Install new Software… to invoke dialog Available Software and press Add….
Sub-dialog Add Repository pops up.
In there provide m2e as name and
http://download.eclipse.org/technology/m2e/releases
as location.
After confirmation with Add, choose the new site to Work with: Eclipse now looks up the site for available software.
Provided Group items by category is checked, above features are displayed. Check all features and confirm all following questions about licenses and security concerns.
After download is complete — it can take a few minutes — restart Eclipse.
Verify that Maven version 3.6.3 or above is now installed in Window → Preferences… (or Eclipse → Preferences… on macOS) under Maven → Installations.

"Correct" way to add third party Java libraries as plugins
Example Indriya