Panel types for dashboards (DEPRECATED) (FREE)
Deprecated in GitLab 14.7.
WARNING: This feature is in its end-of-life process. It is deprecated in GitLab 14.7, and is planned for removal in GitLab 16.0.
The below panel types are supported in monitoring dashboards.
Area or Line Chart
To add an area chart panel type to a dashboard, look at the following sample dashboard file:
dashboard: 'Dashboard Title'
panel_groups:
  - group: 'Group Title'
    panels:
      - type: area-chart  # or line-chart
        title: 'Area Chart Title'
        y_label: 'Y-Axis'
        y_axis:
          format: number
          precision: 0
        metrics:
          - id: area_http_requests_total
            query_range: 'http_requests_total'
            label: 'Instance: {{instance}}, Method: {{method}}'
            unit: "count"
Note the following properties:
| Property | Type | Required | Description |
|---|---|---|---|
| type | string | no | Type of panel to be rendered. Optional for area panel types |
| query_range | string | required | For area panel types, you must use a range query |

Starting in version 12.8, the y-axis values scale according to the data. Previously, it always started from 0.
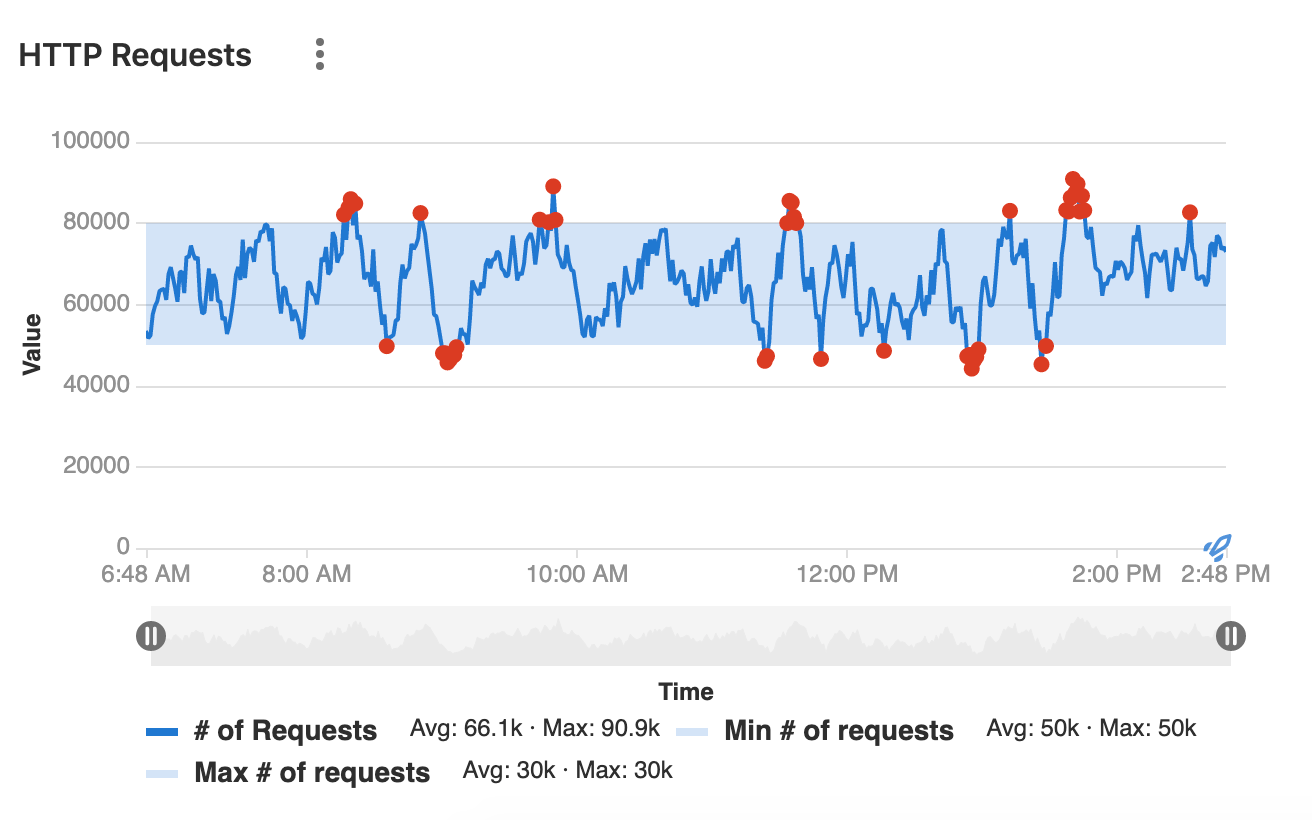
Anomaly chart
Introduced in GitLab 12.5.
To add an anomaly chart panel type to a dashboard, add a panel with exactly 3 metrics.
The first metric represents the current state, and the second and third metrics represent the upper and lower limit respectively:
dashboard: 'Dashboard Title'
panel_groups:
  - group: 'Group Title'
    panels:
      - type: anomaly-chart
        title: 'Chart Title'
        y_label: "Y-Axis"
        metrics:
          - id: anomaly_requests_normal
            query_range: 'http_requests_total'
            label: '# of Requests'
            unit: 'count'
          - id: anomaly_requests_upper_limit
            query_range: 10000
            label: 'Max # of requests'
            unit: 'count'
          - id: anomaly_requests_lower_limit
            query_range: 2000
            label: 'Min # of requests'
            unit: 'count'
Note the following properties:
| Property | Type | Required | Description |
|---|---|---|---|
| type | string | required | Must be anomaly-chart for anomaly panel types |
| query_range | yes | required | For anomaly panel types, you must use a range query in every metric. |
Bar chart
To add a bar chart to a dashboard, look at the following sample dashboard file:
dashboard: 'Dashboard Title'
panel_groups:
  - group: 'Group title'
    panels:
      - type: bar
        title: 'HTTP Handlers'
        x_label: 'Response Size'
        y_axis:
          name: 'Handlers'
        metrics:
          - id: prometheus_http_response_size_bytes_bucket
            query_range: 'sum(increase(prometheus_http_response_size_bytes_bucket[1d])) by (handler)'
            unit: 'Bytes'
Note the following properties:
| Property | Type | Required | Description |
|---|---|---|---|
type |
string | yes | Type of panel to be rendered. For bar chart types, set to bar
|
query_range |
yes | yes | For bar chart, you must use a range query |

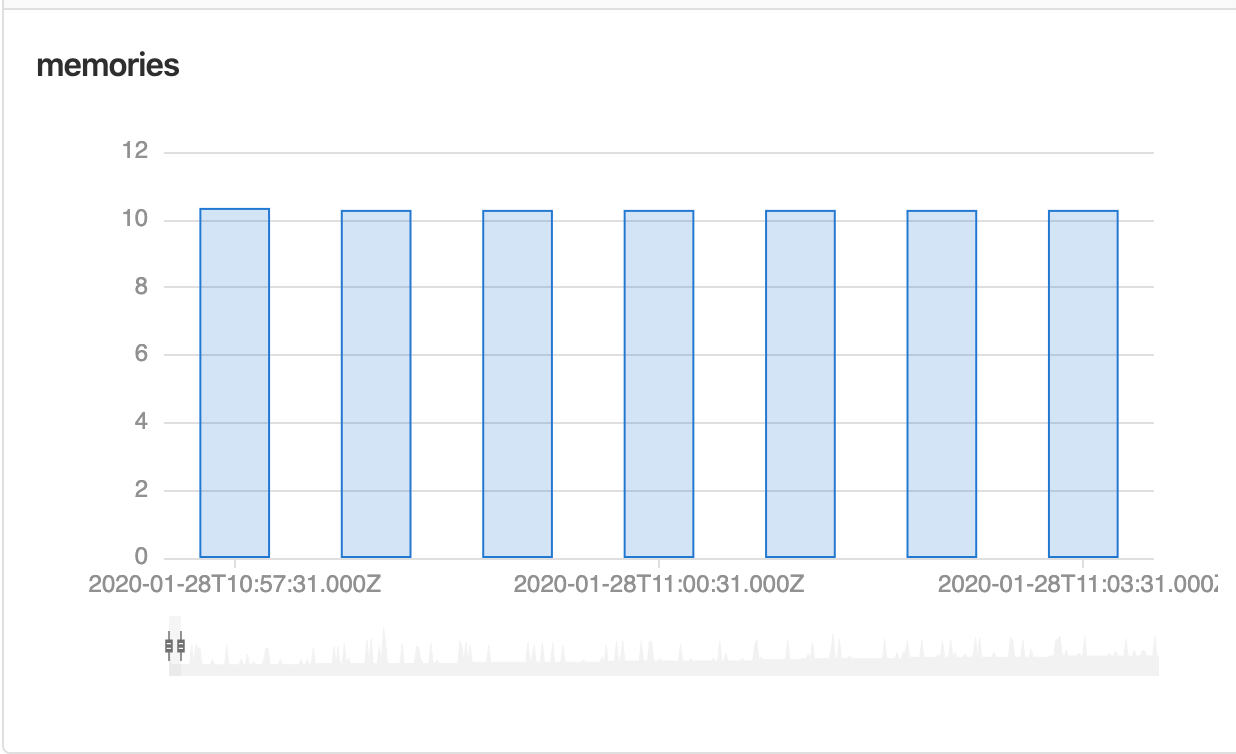
Column chart
To add a column panel type to a dashboard, look at the following sample dashboard file:
dashboard: 'Dashboard Title'
panel_groups:
  - group: 'Group title'
    panels:
      - title: 'Column'
        type: 'column'
        metrics:
        - id: 1024_memory
          query: 'avg(sum(container_memory_usage_bytes{container_name!="POD",pod_name=~"^%{ci_environment_slug}-([^c].*|c([^a]|a([^n]|n([^a]|a([^r]|r[^y])))).*|)-(.*)",namespace="%{kube_namespace}"}) by (job)) without (job) / count(avg(container_memory_usage_bytes{container_name!="POD",pod_name=~"^%{ci_environment_slug}-([^c].*|c([^a]|a([^n]|n([^a]|a([^r]|r[^y])))).*|)-(.*)",namespace="%{kube_namespace}"}) without (job)) /1024/1024'
          unit: MB
          label: 'Memory Usage'
Note the following properties:
| Property | Type | Required | Description |
|---|---|---|---|
| type | string | yes | Type of panel to be rendered. For column panel types, set to column
|
| query_range | yes | yes | For column panel types, you must use a range query |
Stacked column
Introduced in GitLab 12.8.
To add a stacked column panel type to a dashboard, look at the following sample dashboard file:
dashboard: 'Dashboard title'
priority: 1
panel_groups:
  - group: 'Group Title'
    priority: 5
    panels:
      - type: 'stacked-column'
        title: 'Stacked column'
        y_label: 'y label'
        x_label: 'x label'
        metrics:
          - id: memory_1
            query_range: 'memory_query'
            label: 'memory query 1'
            unit: 'count'
            series_name: 'group 1'
          - id: memory_2
            query_range: 'memory_query_2'
            label: 'memory query 2'
            unit: 'count'
            series_name: 'group 2'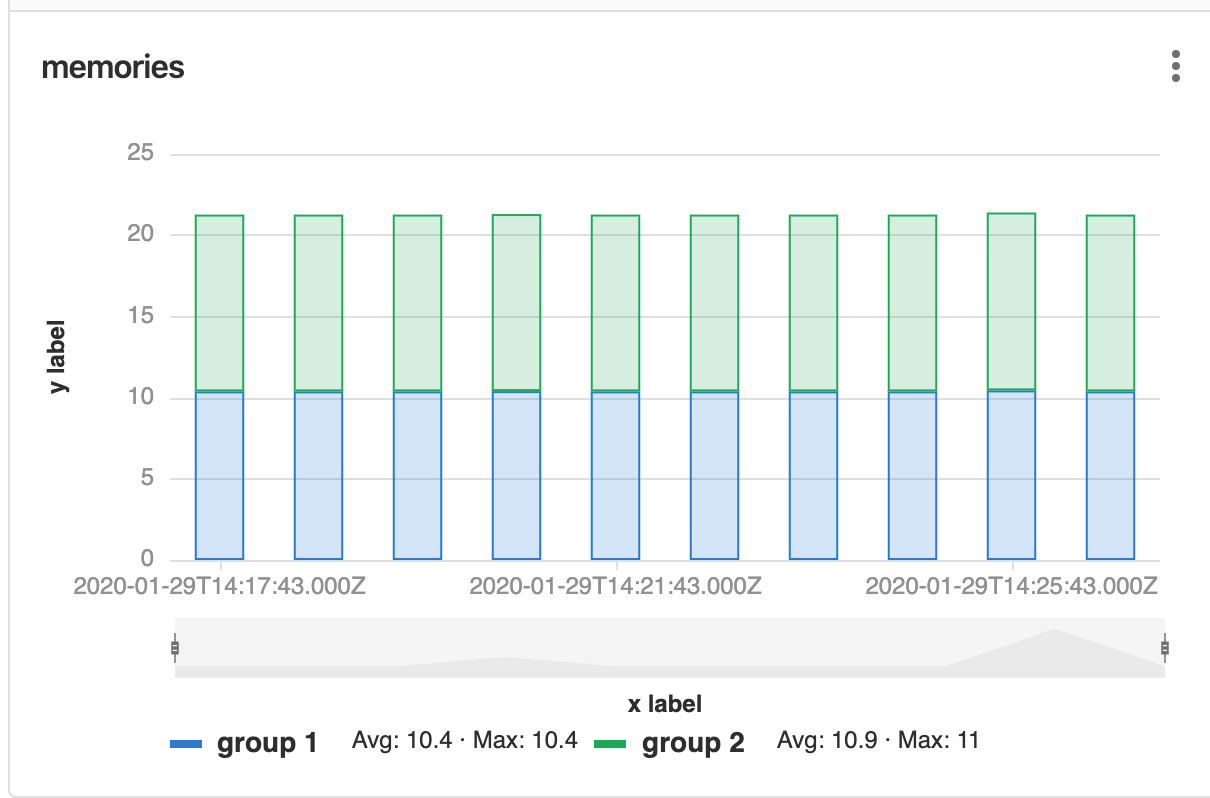
| Property | Type | Required | Description |
|---|---|---|---|
type |
string | yes | Type of panel to be rendered. For stacked column panel types, set to stacked-column
|
query_range |
yes | yes | For stacked column panel types, you must use a range query |
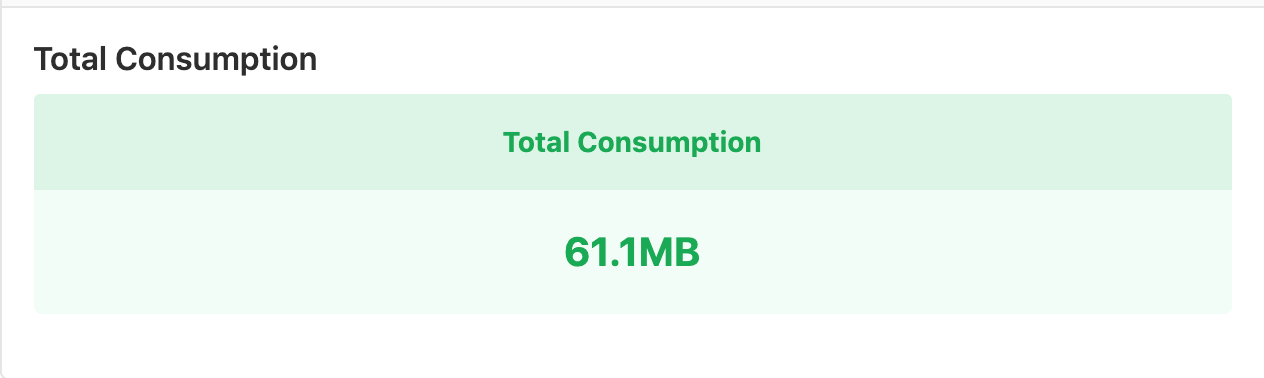
Single Stat
To add a single stat panel type to a dashboard, look at the following sample dashboard file:
dashboard: 'Dashboard Title'
panel_groups:
  - group: 'Group Title'
    panels:
      - title: 'Single Stat'
        type: 'single-stat'
        metrics:
          - id: 10
            query: 'max(go_memstats_alloc_bytes{job="prometheus"})'
            unit: MB
            label: 'Total'
Note the following properties:
| Property | Type | Required | Description |
|---|---|---|---|
| type | string | yes | Type of panel to be rendered. For single stat panel types, set to single-stat
|
| field | string | no | Panels display the value of a metric. For a panel to display the value of a label instead, put the name of the label in this key. |
| query | string | yes | For single stat panel types, you must use an instant query |
Percentile based results
Introduced in GitLab 12.8.
Query results sometimes need to be represented as a percentage value out of 100. You can use the max_value property at the root of the panel definition:
dashboard: 'Dashboard Title'
panel_groups:
  - group: 'Group Title'
    panels:
      - title: 'Single Stat'
        type: 'single-stat'
        max_value: 100
        metrics:
          - id: 10
            query: 'max(go_memstats_alloc_bytes{job="prometheus"})'
            unit: '%'
            label: 'Total'
For example, if you have a query value of 53.6, adding % as the unit results in a single stat value of 53.6%, but if the maximum expected value of the query is 120, the value would be 44.6%. Adding the max_value causes the correct percentage value to display.
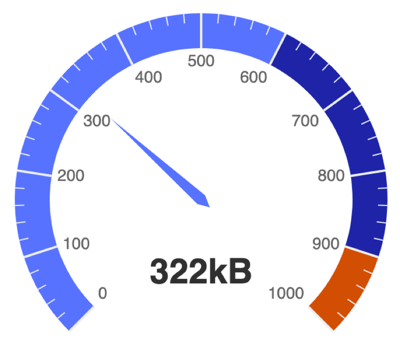
Gauge
WARNING: This panel type is an Alpha feature, and is subject to change at any time without prior notice!
Introduced in GitLab 13.3.
To add a gauge panel type to a dashboard, look at the following sample dashboard file:
dashboard: 'Dashboard Title'
panel_groups:
  - group: 'Group Title'
    panels:
      - title: 'Gauge'
        type: 'gauge'
        min_value: 0
        max_value: 1000
        split: 5
        thresholds:
          values: [60, 90]
          mode: 'percentage'
        format: 'kilobytes'
        metrics:
          - id: 10
            query: 'floor(max(prometheus_http_response_size_bytes_bucket)/1000)'
            unit: 'kb'
Note the following properties:
| Property | Type | Required | Description |
|---|---|---|---|
| type | string | yes | Type of panel to be rendered. For gauge panel types, set to gauge. |
| min_value | number | no, defaults to 0
|
The minimum value of the gauge chart axis. If either of min_value or max_value are not set, they both get their default values. |
| max_value | number | no, defaults to 100
|
The maximum value of the gauge chart axis. If either of min_value or max_value are not set, they both get their default values. |
| split | number | no, defaults to 10
|
The amount of split segments on the gauge chart axis. |
| thresholds | object | no | Thresholds configuration for the gauge chart axis. |
| format | string | no, defaults to engineering
|
Unit format used. See the full list of units. |
| query | string | yes | For gauge panel types, you must use an instant query. |
Thresholds properties
| Property | Type | Required | Description |
|---|---|---|---|
| values | array | no, defaults to 95% of the range between min_value and max_value
|
An array of gauge chart axis threshold values. |
| mode | string | no, defaults to absolute
|
The mode in which the thresholds are interpreted in relation to min_value and max_value. Can be either percentage or absolute. |
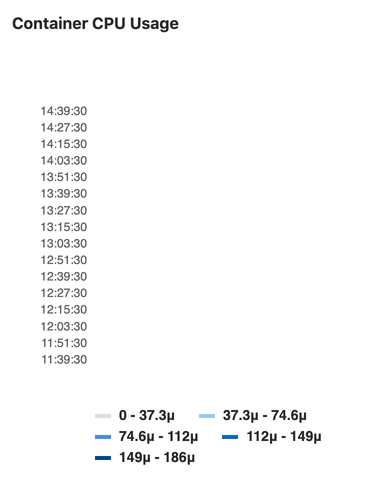
Heatmaps
Introduced in GitLab 12.5.
To add a heatmap panel type to a dashboard, look at the following sample dashboard file:
dashboard: 'Dashboard Title'
panel_groups:
  - group: 'Group Title'
    panels:
      - title: 'Heatmap'
        type: 'heatmap'
        metrics:
          - id: 10
            query: 'sum(rate(nginx_upstream_responses_total{upstream=~"%{kube_namespace}-%{ci_environment_slug}-.*"}[60m])) by (status_code)'
            unit: req/sec
            label: 'Status code'
Note the following properties:
| Property | Type | Required | Description |
|---|---|---|---|
| type | string | yes | Type of panel to be rendered. For heatmap panel types, set to heatmap
|
| query_range | yes | yes | For area panel types, you must use a range query |
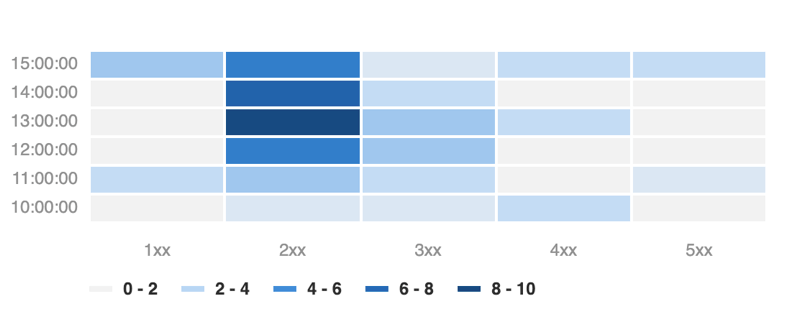
WARNING: When a query returns too many data points, the heatmap data bucket dimensions tend downwards to 0, making the chart's data invisible, as shown in the image below. To fix this problem, limit the amount of data returned by changing the time range filter on the metrics dashboard UI, or adding the step property to your dashboard's YAML file.