GitLab Security Dashboards and Security Center (ULTIMATE)
You can use Security Dashboards to view trends about vulnerabilities detected by security scanners. These trends are shown in projects, groups, and the Security Center.
To use the Security Dashboards, you must:
- Configure at least one security scanner in a project.
- Configure jobs to use the
reportssyntax. - Use GitLab Runner 11.5 or later. If you use the shared runners on GitLab.com, you are using the correct version.
- Have the correct role for the project or group.
When Security Dashboards are updated
The Security Dashboards show results of the most recent security scan on the default branch. Security scans run only when the default branch updates, so information on the Security Dashboard might not reflect newly-discovered vulnerabilities.
To run a daily security scan, configure a scheduled pipeline.
Reduce false negatives in dependency scans
WARNING: False negatives occur when you resolve dependency versions during a scan, which differ from those resolved when your project built and released in a previous pipeline.
To reduce false negatives in dependency scans in scheduled pipelines, ensure you:
- Include a lock file in your project. A lock file lists all transient dependencies and tracks their versions.
- Java projects can't have lock files.
- Python projects can have lock files, but GitLab Secure tools don't support them.
- Configure your project for Continuous Delivery.
View vulnerabilities over time for a project
- Introduced in GitLab 13.6.
- Introduced in GitLab 13.10, options to zoom in on a date range, and download the vulnerabilities chart.
- Introduced in GitLab 13.11, date range slider to visualize data between given dates.
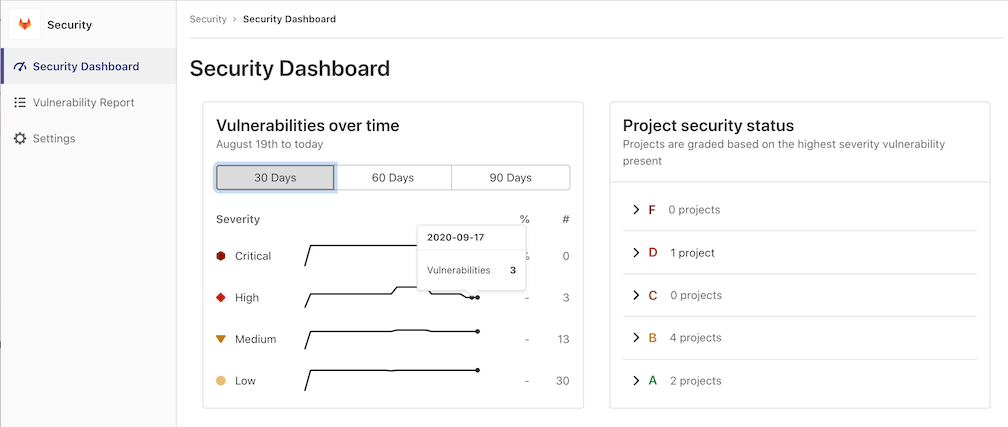
The project Security Dashboard shows the total number of vulnerabilities
over time, with up to 365 days of historical data. Data refresh begins daily at 01:15 UTC via a scheduled job.
Each refresh captures a snapshot of open vulnerabilities. Data is not backported to prior days
so vulnerabilities opened after the job has already run for the day will not be reflected in the
counts until the following day's refresh job.
Project Security Dashboards show statistics for all vulnerabilities with a current status of Needs triage or Confirmed .
To view total number of vulnerabilities over time:
- On the top bar, select Main menu > Projects and find your project.
- On the left sidebar, select Security & Compliance > Security Dashboard.
- Filter and search for what you need.
- To filter the chart by severity, select the legend name.
- To view a specific time frame, use the time range handles ({scroll-handle}).
- To view a specific area of the chart, select the left-most icon ({marquee-selection}) and drag across the chart.
- To reset to the original range, select Remove Selection ({redo}).
Download the vulnerabilities chart
To download an SVG image of the vulnerabilities chart:
- On the top bar, select Main menu > Projects and find your project.
- On the left sidebar, select Security & Compliance > Security dashboard.
- Select Save chart as an image ({download}).
View vulnerabilities over time for a group
The group Security Dashboard gives an overview of vulnerabilities found in the default branches of projects in a group and its subgroups.
To view vulnerabilities over time for a group:
- On the top bar, select Main menu > Groups and select a group.
- Select Security > Security Dashboard.
- Hover over the chart to get more details about vulnerabilities.
- You can display the vulnerability trends over a 30, 60, or 90-day time frame (the default is 90 days).
- To view aggregated data beyond a 90-day time frame, use the VulnerabilitiesCountByDay GraphQL API. GitLab retains the data for 365 days.
View project security status for a group
Use the group Security Dashboard to view the security status of projects.
To view project security status for a group:
- On the top bar, select Main menu > Groups and select a group.
- Select Security > Security Dashboard.
Each project is assigned a letter grade according to the highest-severity open vulnerability. Dismissed or resolved vulnerabilities are excluded. Each project can receive only one letter grade and will appear only once in the Project security status report.
To view vulnerabilities, go to the group's vulnerability report.
Project vulnerability grades
| Grade | Description |
|---|---|
| F | One or more critical vulnerabilities |
| D | One or more high or unknown vulnerabilities |
| C | One or more medium vulnerabilities |
| B | One or more low vulnerabilities |
| A | Zero vulnerabilities |
Security Center
Introduced in GitLab 13.4.
The Security Center is a personal space where you view vulnerabilities across all your projects. It shows the vulnerabilities present in the default branches of the projects.
The Security Center includes:
- The group Security Dashboard.
- A vulnerability report.
- A settings area to configure which projects to display.
View the Security Center
To view the Security Center, on the top bar, select Main menu > Security.
Add projects to the Security Center
To add projects to the Security Center:
- On the top bar, select Main menu > Security.
- On the left sidebar, select Settings, or select Add projects.
- Use the Search your projects text box to search for and select projects.
- Select Add projects.
After you add projects, the security dashboard and vulnerability report show the vulnerabilities found in those projects' default branches.